Enjoy our monthly newsletter filled with latest real estate news, tips, and facts. You can unsubscribe any time and we will not share your email address with others.
May 2023 – Monthly Vancouver Real Estate Update

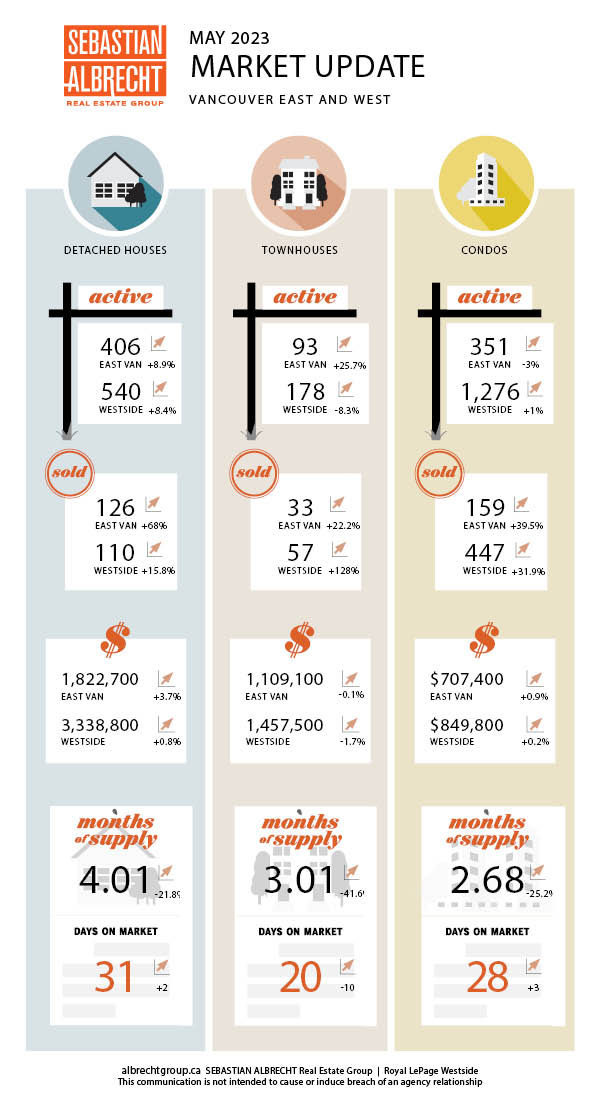
May was another month of strengthening in the Vancouver real estate market. Once again, we moved away from the Buyer's Market of late 2022 and saw increasing demand along with very limited supply.
Sales rose to 985. This was a big increase (+34%) from last month, and well above (+9.6%) a year ago. This was is actually the first time since February 2023 that we have seen a year-over-year INCREASE in sales (985 vs 899).
It's also been a year since sales were actually above the 10-year average (April 2022). May makes the 4th month in a row that we've steadily moved closer to the 10-year average...and now just -1.75% below (985 vs 1003).
Meanwhile, there was no shortage of new listings. We saw a jump to 1806 New Listings in May. This was up (+36%) from last month but down (-7.8%) from a year ago. It was also basically right on the 10-year average (+0.7%).
Total Active Listings (supply) rose to 3,021. This was up (+3.3%) slightly from last month and signifcantly lower (-20.4%) than a year ago....
April 2023 – Monthly Vancouver Real Estate Update

With listings continuing to languish, home sales in Vancouver continue to bounce back to more historical norms. While we are still below the 10-year average and last year, this rapid comeback has surprised many after seeing eight consecutive interest rate hikes.
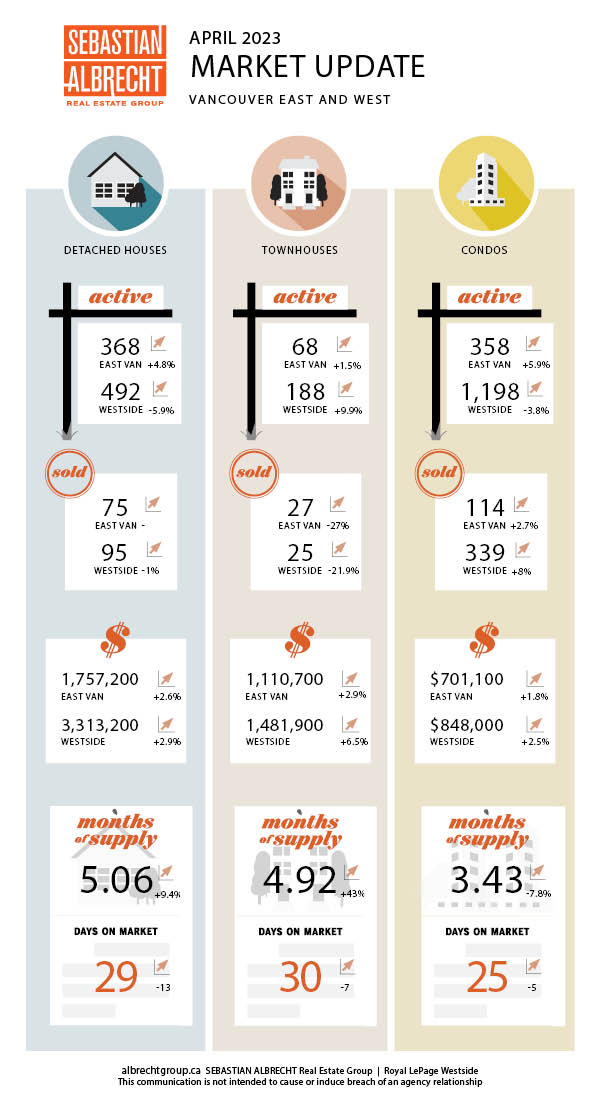
There were 735 home sales in Vancouver in April. This was basically flat over the previous month (-0.8%) but down a fairly significant -24.3% over the previous year...and -20% from the 10-year average.
New Listings fell slightly to 1,327 (-4.3% month-to-month and -31.7% year-to-year). This was -21.7% from the 10-year average.
With steady sales and a decline in new listings, Total Active Listings fell to 2,833. This was -2% m-to-m and -18.2% y-to-y. But most significantly this was -14.3% from the 10-year average.
Over the last 4 months we've seen a steady trend of demand increasing toward the historical norm while supply decreases. This has been putting increasing pressure on prices as eager buyers compete for the limited supply of...
March 2023 – Monthly Vancouver Real Estate Update

After nearly a year of weakening, we now have a second month of strength. And the momentum is building.
By no means are we back to unsustainable levels of market activity. In fact, by most measures activity is still below the 10-year average. BUT, the trend is that the differences are shrinking.
The market is no longer frozen by fear (as it was toward the end of last year) and optimism continues to build.
Sales jumped to 741. That's up +43.6% month-to-month but down nearly -43% from a year ago. This was down -27.5% from the 10-year average (1,022).
New listings increased to 1386 which was up +27.2% from last month and down -34.6% from a year ago. It was also down -17.5% from the 10-year (1679).
Active listings rose to 2824. This was just -1.2% off last month and down -10.1% from a year ago...but down -6.8% from the 10-year (3031).
So, demand is growing (sales) and supply (listings) continue to remain subdued. As a result, we are seeing a return to price...
February 2023 – Monthly Vancouver Real Estate Update

Signs of the nadir of our market being behind us abound.
There's a renewed sense of optimism. It's night and day from last month when it appears pessimism peaked.
While things are improving, we are still well below the 10-year average on most fronts. Year-to-year comparisons will continue to look dismal as the last couple of years were quite extraordinary in our market.
Sales rose to 518. That's up nearly 65% from January (but down almost 50% from a year ago). It is also down 33% from the 10-year average (811).
New Listings increased marginally to 1,090. That was up +2.7% from a month ago but down -36.4% from a year ago. It was also down -24% from the 10-year average (1,436).
Active Listings rose very slightly to 2,769. That was up +1% from last month and down -5.5% from a year ago. It was also -7% from the 10-year average (2,769).
Prices are down across the board over the last year. However,...
January 2023 – Monthly Vancouver Real Estate Update

January was very quiet in the Vancouver real estate market.
That's not unusual. January is typically the slowest month of the year...but this last month was unusually slow relative to what we typically see.
ALL activity was well below the 10-year average. But it's sales (demand) that took the biggest dip in January. The 313 sales were -38.4% below the 10-year average (-15.2% m-to-m and -55.3% y-to-y).
New listings increased over December to 1,061 (+170.1% m-to-m and -27.4% y-to-y). This was also down significantly (-29.1%) vs the 10-year average.
Overall listing inventory rose slightly to 2,631 (+0.5% m-to-m and -2.3% y-to-y).
We continue to see more stability/strength at the lower price points in our market. We can see that detached homes continue to become more affordable while lower price points pricing has stabilized in recent months.
Are things going to get worse from here?
I don't believe so, no.
Here's why.
1. Seasonality - January is typically the slowest month for sales. That month...
December 2022 – Monthly Vancouver Real Estate Update

After a torrid surge in market activity through the COVID lockdown, it fell off significantly over the last year. This was brought about primarily by the Bank of Canada trying to get inflation under control by rapidly hiking the policy rate.
These higher interest rates are clearly having a big impact on both buyers and sellers of Vancouver real estate.
Sales fell to 246 which was -20.1% month-to-month and -47.4% year-to-year. This was also well below the 10-year average (-34.2%).
New Listings also dropped to 246 which was -67% from last month and -38% from a year ago. It was also -17.8% from the 10-year average.
Total Active Listings reached 2423 or -26.5% from the previous month and only -1.7% from a year ago. This was +10.4% vs the 10-year average.
In the meantime we are seeing the decrease in demand of the last year impacting prices. Every property type in Vancouver fell last month...from East Van condos which...
November 2022 – Monthly Vancouver Real Estate Update

November is historically a quieter month in terms of real estate market activity. As we approach the holidays sales and listings cool off...and this year is no exception.
Vancouver home sales dropped -11.4% from the previous month and a whopping -53.6% from a year ago. The 476 were also -37.2% below the 10-year average.
Obviously, this was not just a typically quiet November. It's the inflationary backdrop that is giving real estate buyers pause in recent months. As inflation continues to increase, the Bank of Canada has made clear so will interest rates.
That action continues to most significantly impact the demand for real estate (and thus sales). And while demand has been stifled so has (to a lesser extent) supply.
New listings (1,076) were -17% from the previous month and -20.9% from a year ago. Total active listings (3303) were down -6.1% from October and -1.7% from last year. Both of these supply side metrics were essentially on par with their 10-year averages.
Meanhwile, prices are...
October 2022 – Monthly Vancouver Real Estate Update

Sales were up (+11.9%) last month over the previous month, but down (-45.5%) from a year ago....and down a very significant -32% from the 10-year average.
We typically see a bump in sales in October over September, so I wouldn't read too much into the monthly increase. What's most significant is that big drop from the 10-year average...so demand clearly remains well below typical levels for this time of year.
New Listings (-4.1% m-to-m) and Total Active Listings (-5.1% m-to-m) both edged lower from the previous month...and both are around 7% off the 10-year average.
These supply numbers indicate that supply is also shrinking. In fact, this is the fourth month in a row that we saw a decline in Total Active Listings (from a high of 3945 back in June). This is unusual at this time of year as the fall season usually sees a bumb in listing activity.
Combined, these numbers tell me that both buyers and sellers are hesitant to act in today's market. Economic headlines and rising interest rates...
September 2022 – Monthly Vancouver Real Estate Update

...increasing economic uncertainty and rising interest rates are at the very root of that decrease in activity. It's a significant change of pace from the last couple of years, but it's important to put it into perspective.
Thankfully, our market cannot be explosive ALL the time. It needs to pause, rest and refresh before taking another leg up.
That's what's happening right now...and it offers an opportunity for a new generation of buyers to step into the market.
So...let's take a closer look at these numbers, shall we?
Sales fell to 480 (from 579). That's a drop of -17% from last month and 49% from a year ago. It's also -28.7% below the 10-year average (trending up from last month in relation to this average).
While demand declined, supply rose. It's an overall marginal increase in supply and it makes sense based on the time of year (we...
Signup for our newsletter
STAY UP-TO-DATE WITH THE LATEST NEWS AND TIPS
As seen in:


