Well...it looks as though my call was the correct one. Things didn't get worse. In fact, they are looking up.
Signs of the nadir of our market being behind us abound.
There's a renewed sense of optimism. It's night and day from last month when it appears pessimism peaked.
While things are improving, we are still well below the 10-year average on most fronts. Year-to-year comparisons will continue to look dismal as the last couple of years were quite extraordinary in our market.
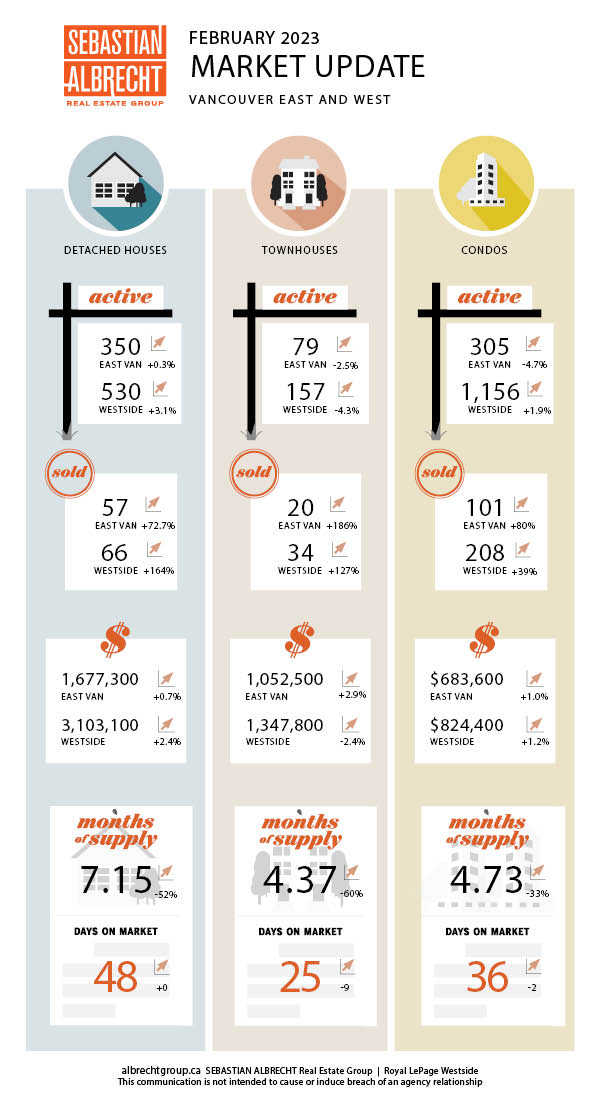
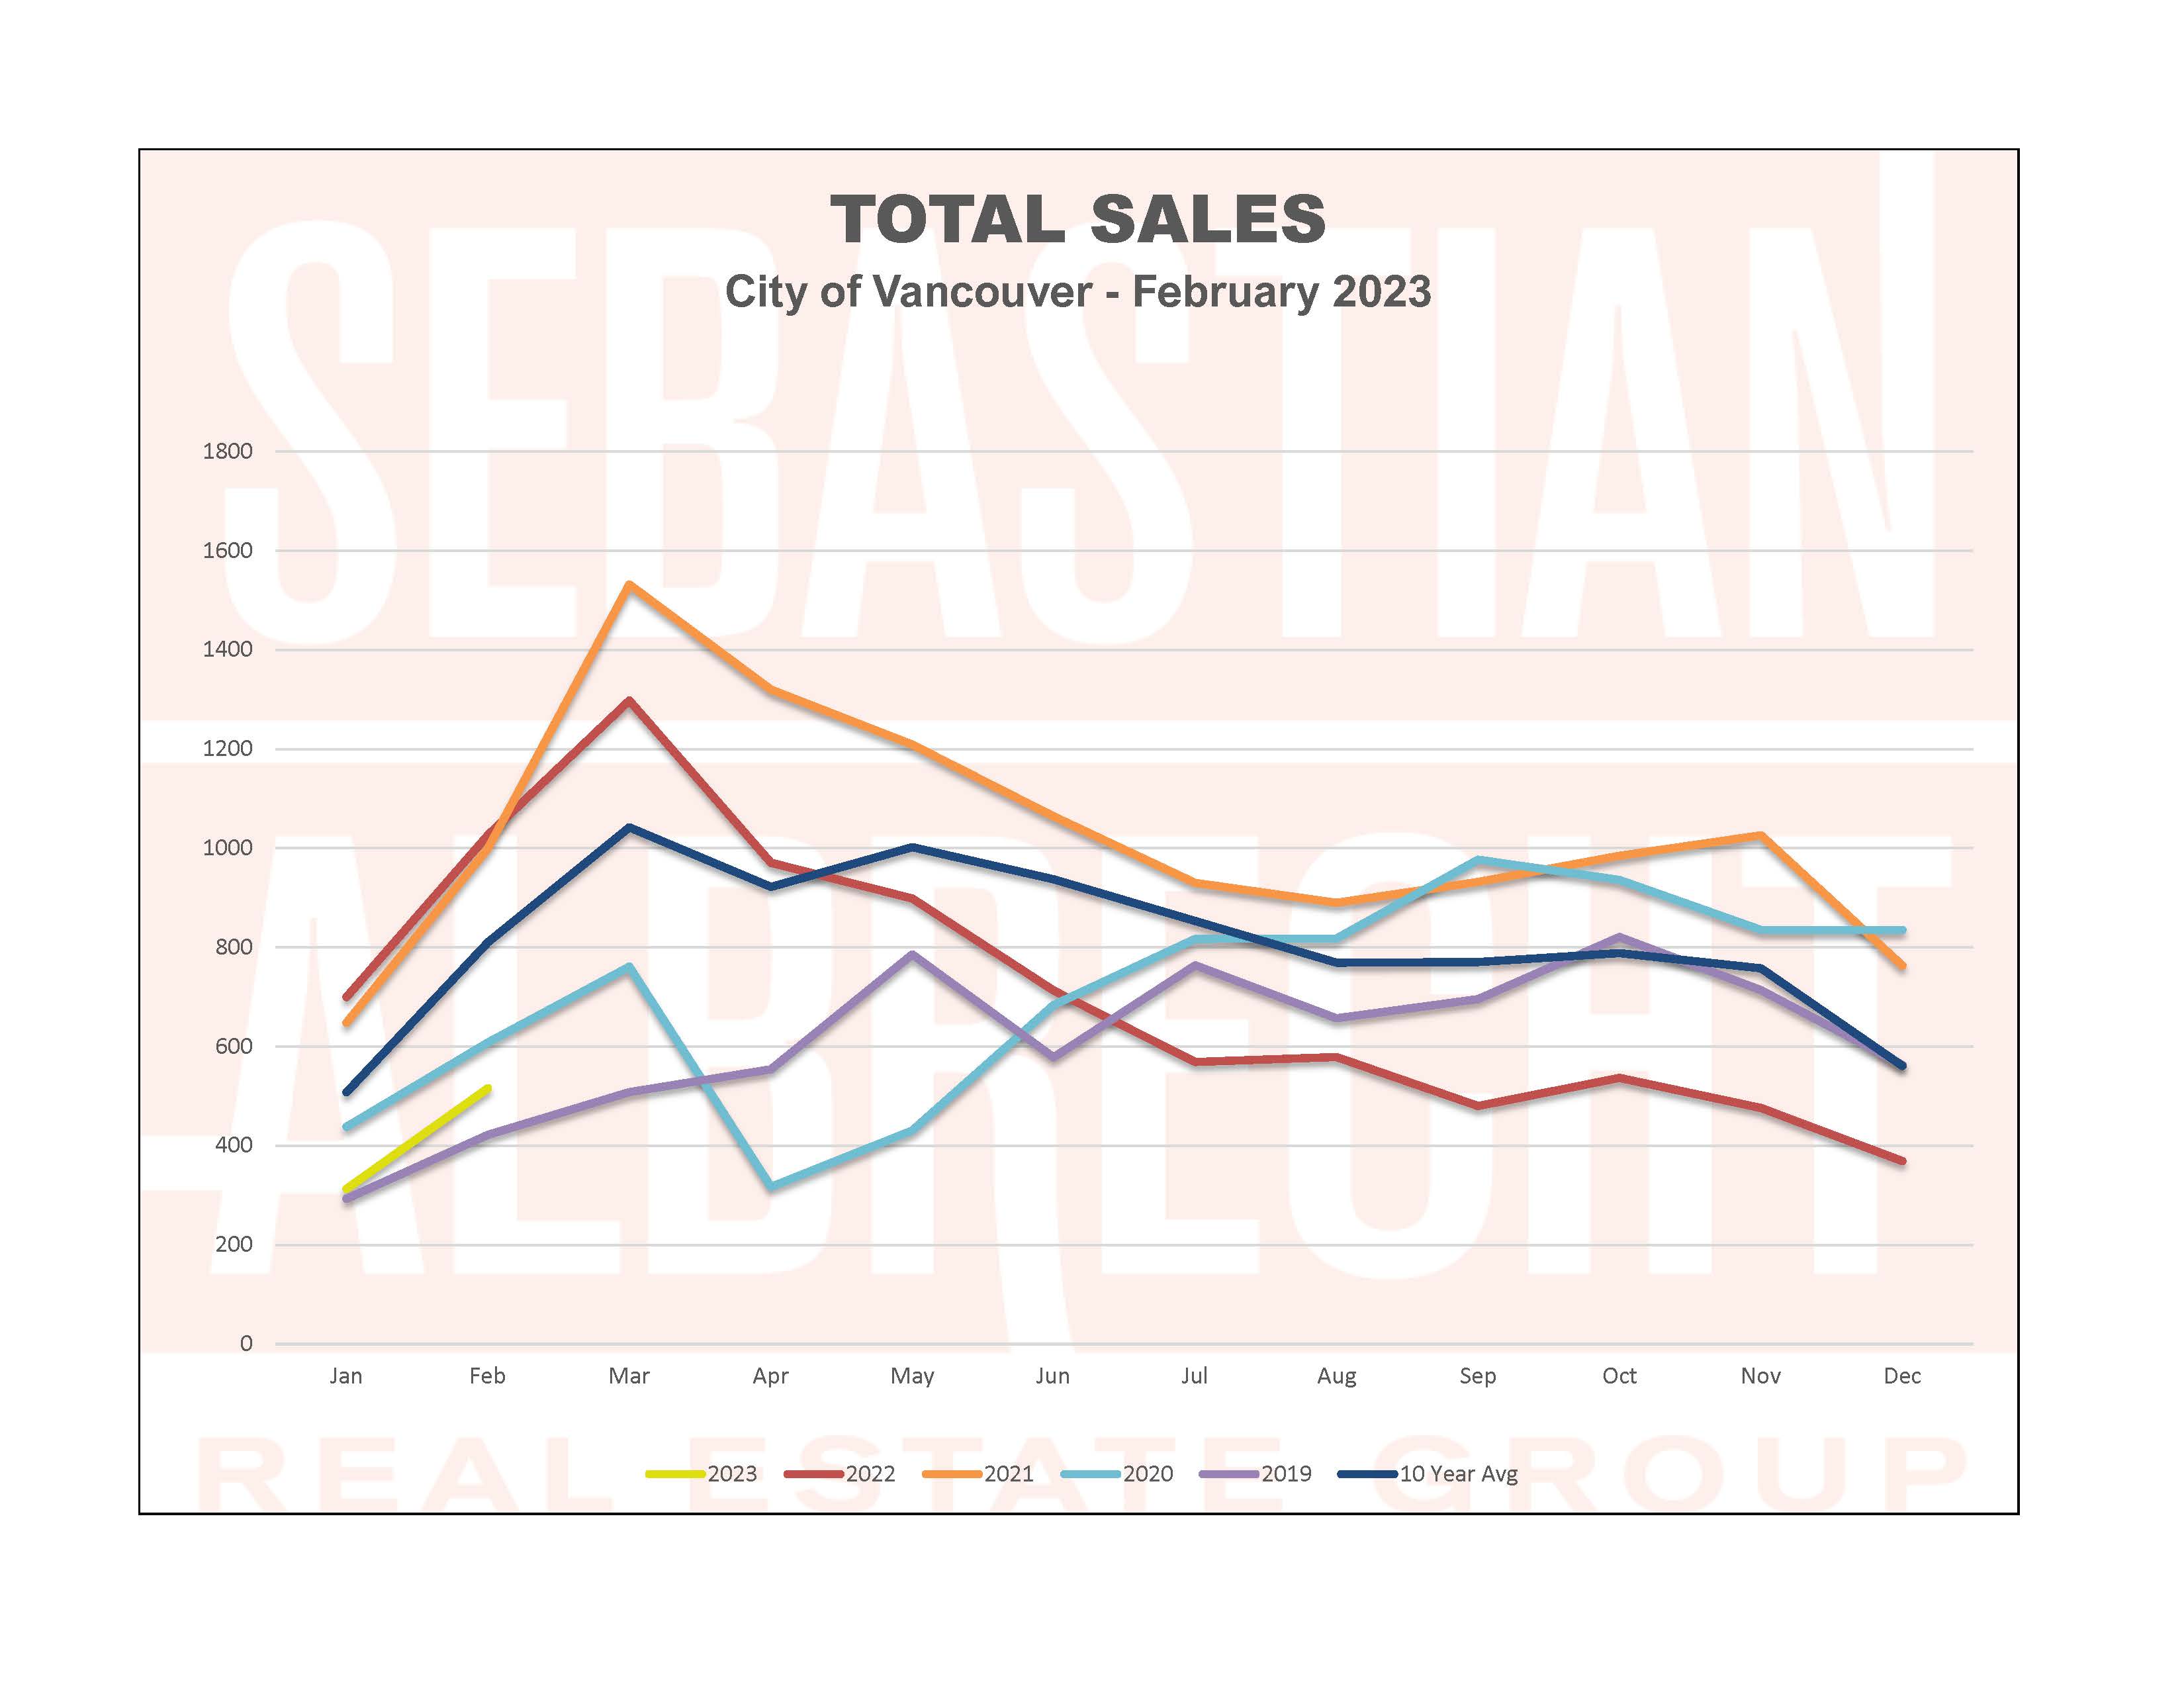
Sales rose to 518. That's up nearly 65% from January (but down almost 50% from a year ago). It is also down 33% from the 10-year average (811).
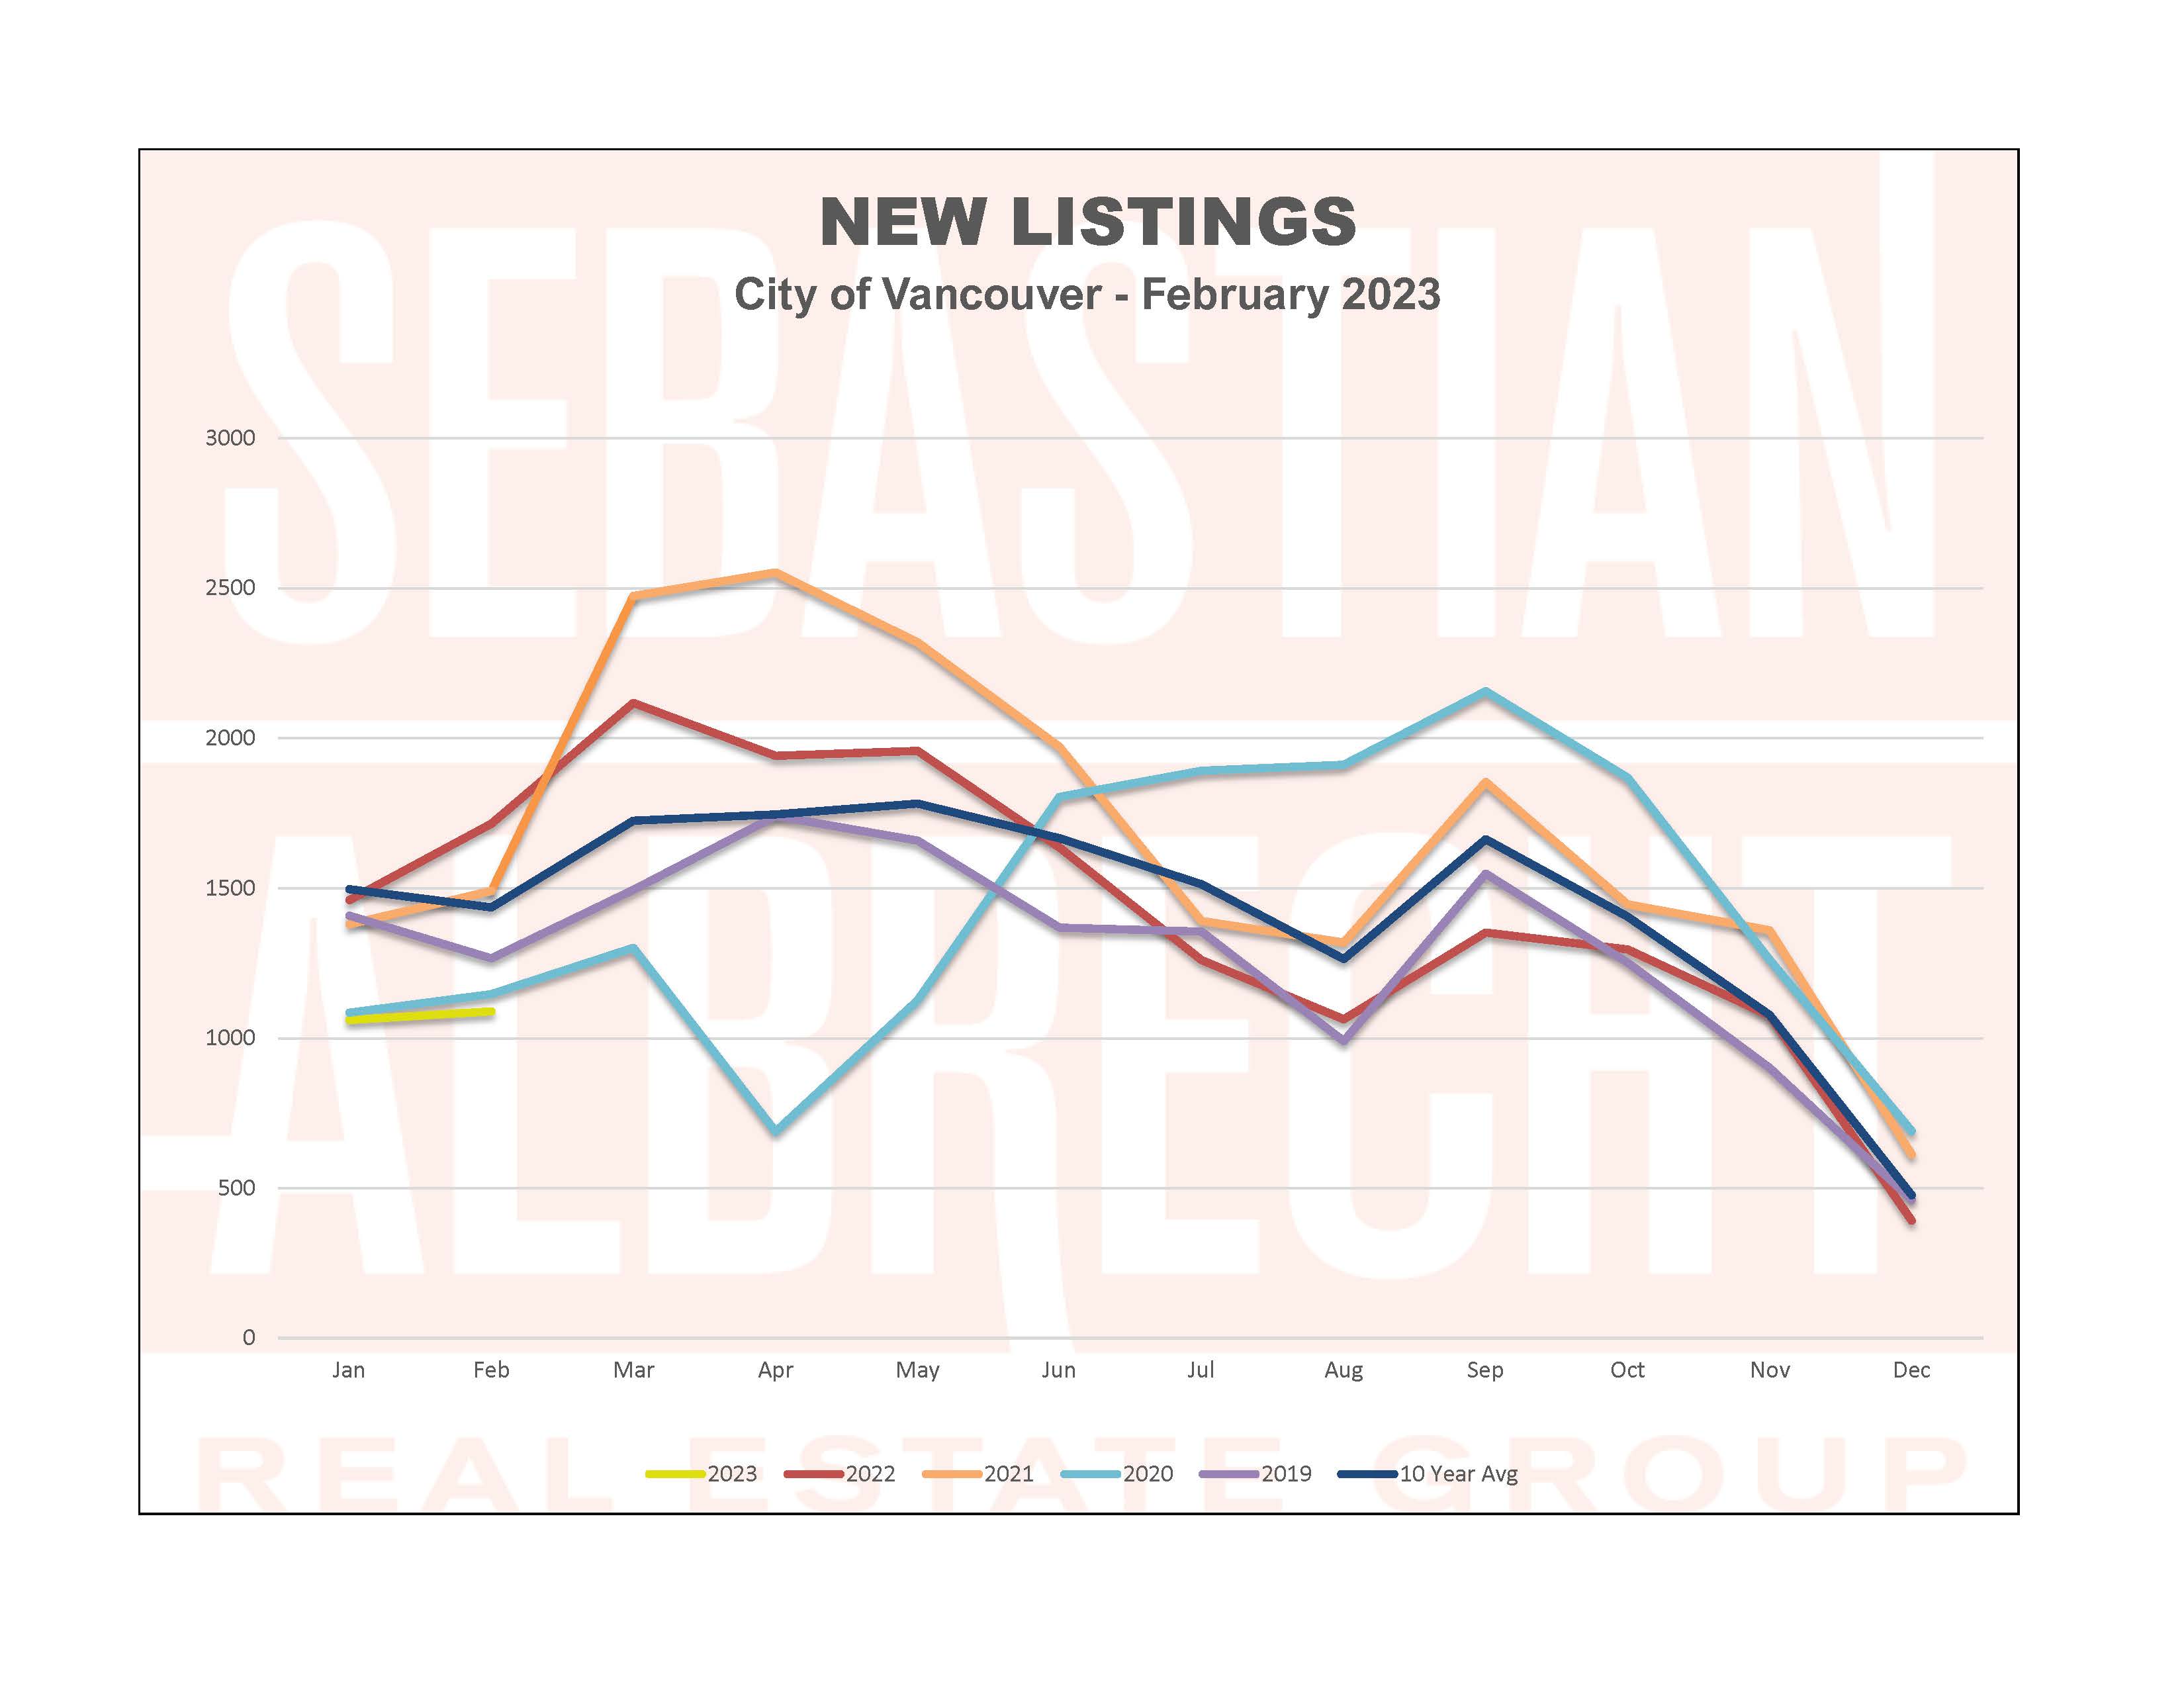
New Listings increased marginally to 1,090. That was up +2.7% from a month ago but down -36.4% from a year ago. It was also down -24% from the 10-year average (1,436).
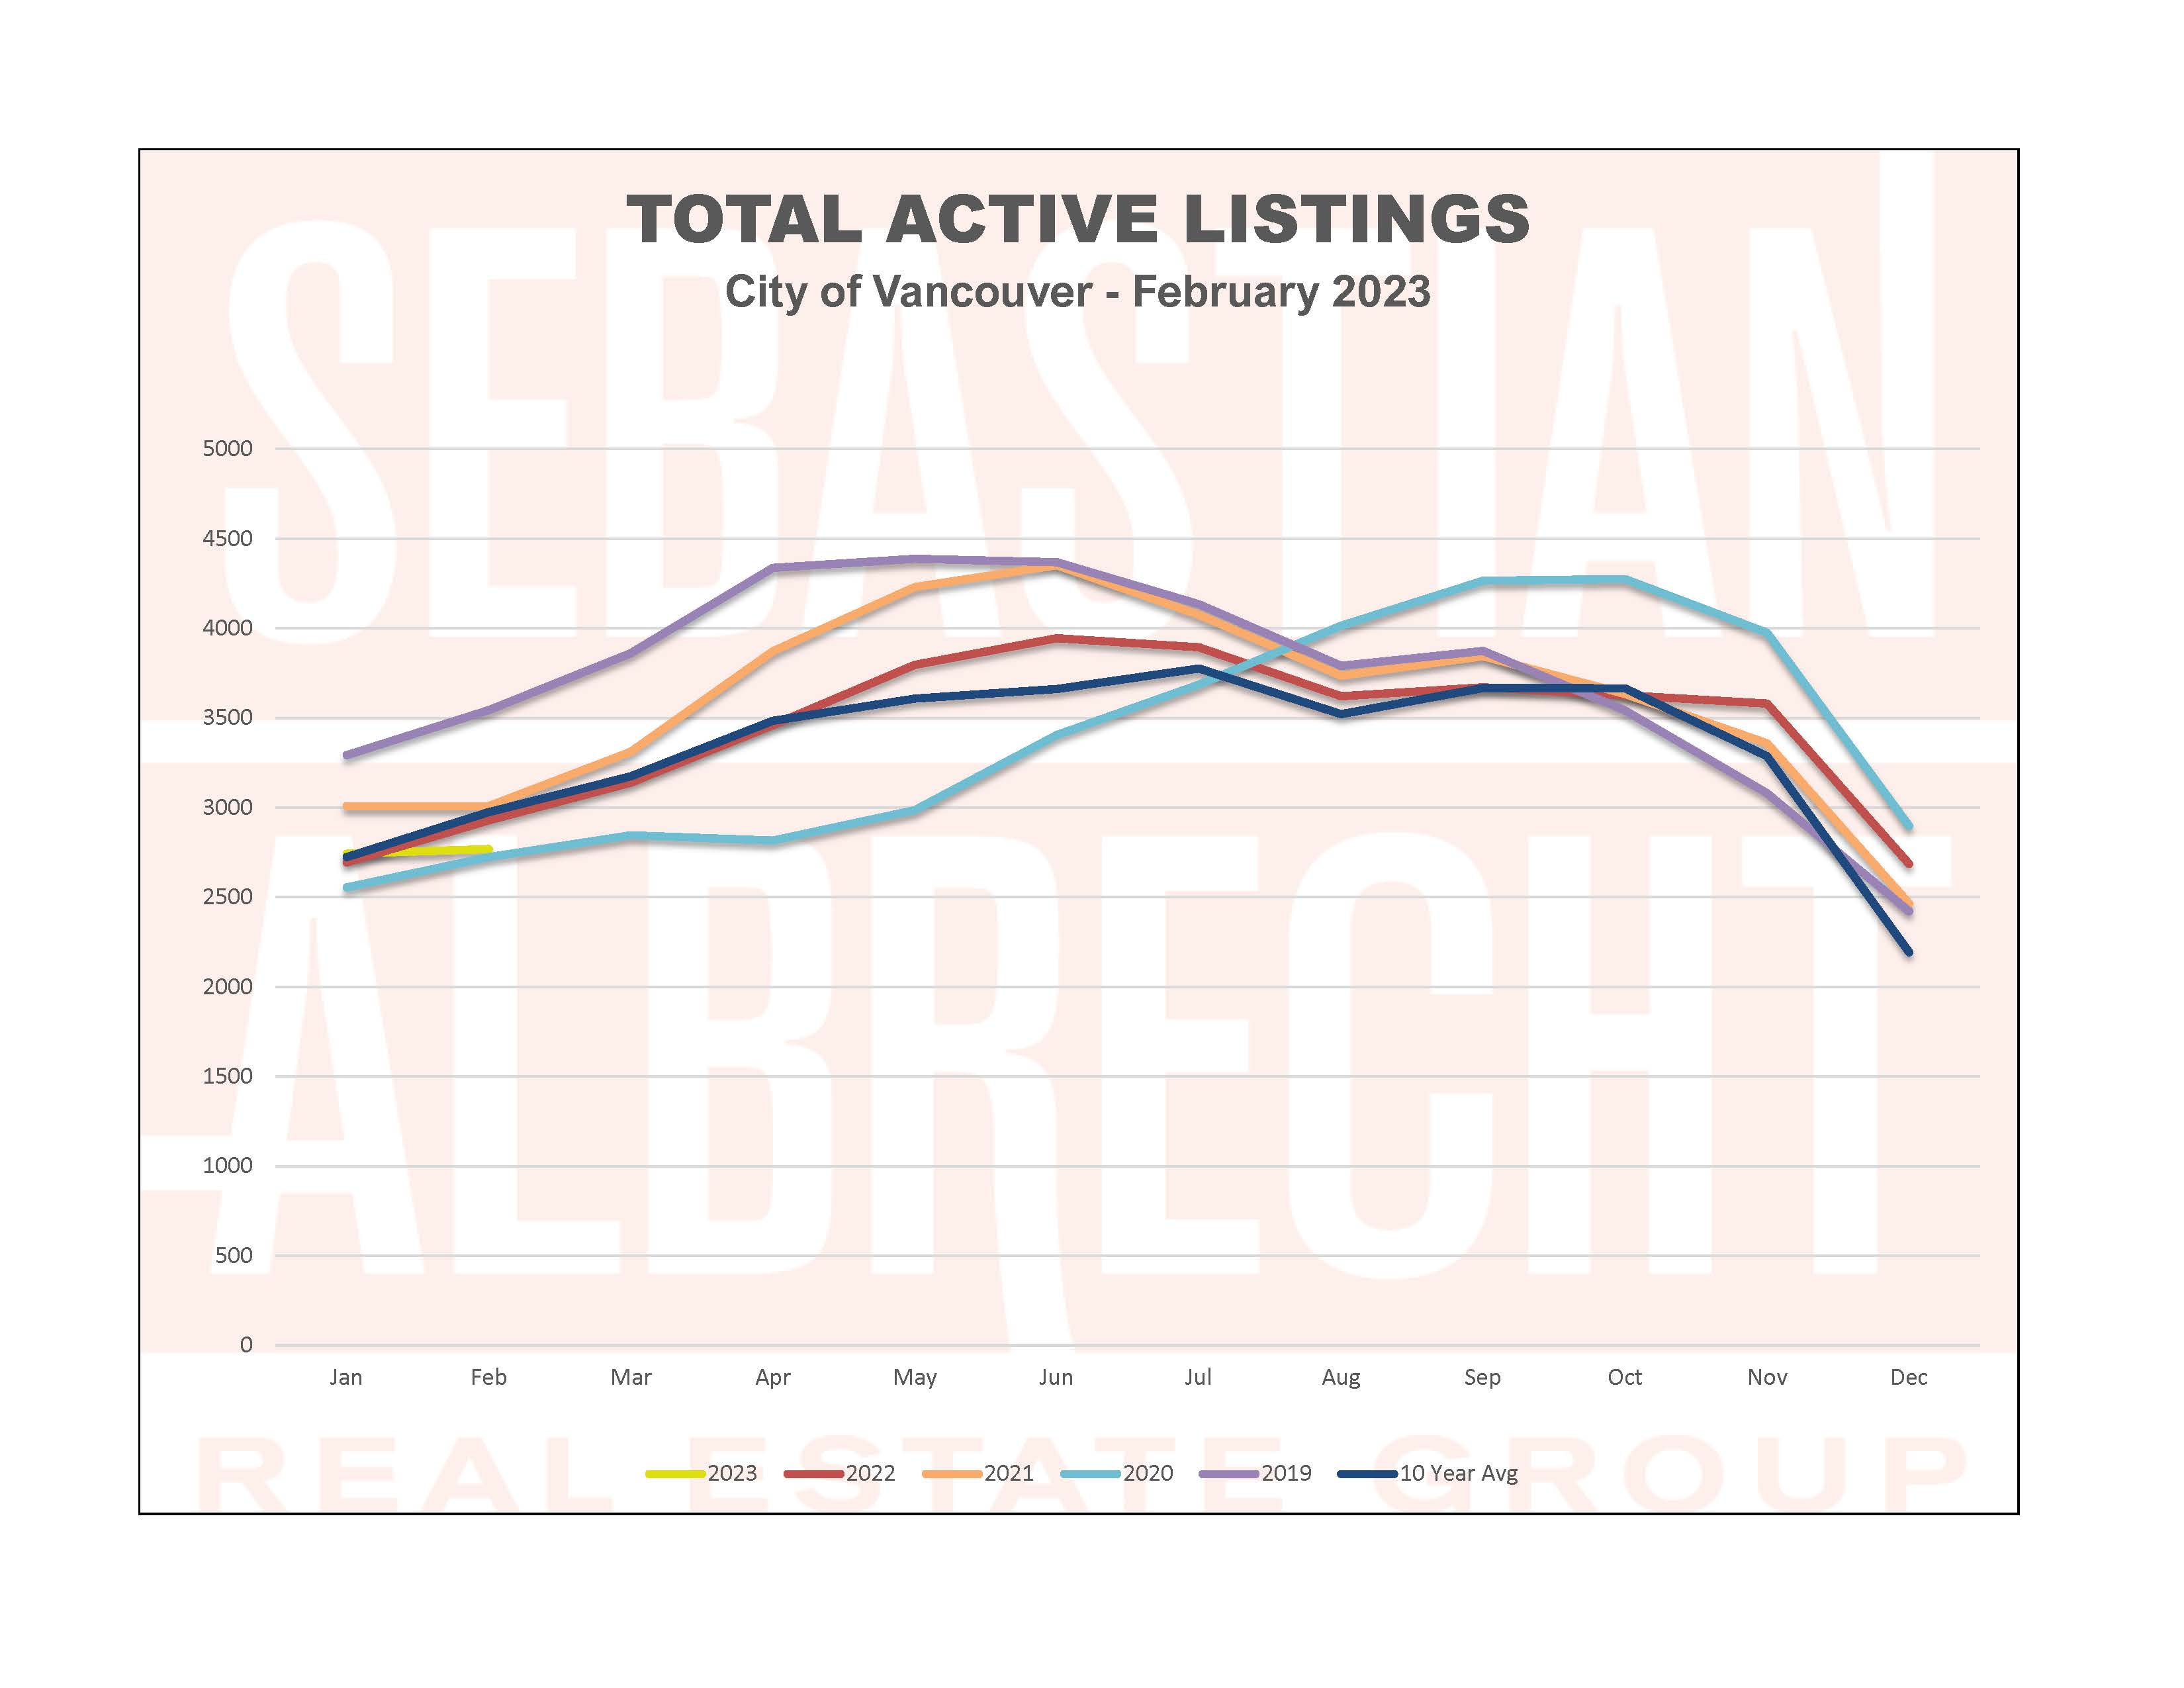
Active Listings rose very slightly to 2,769. That was up +1% from last month and down -5.5% from a year ago. It was also -7% from the 10-year average (2,769).
Prices are down across the board over the last year. However, for the first time in nearly a year we saw nearly every housing type have price increases on a month-to-month basis.
The increases were lead by East Vancouver Townhouses which jumped 2.9% in a single month. This was followed closely by dark horse Westside Houses which were up 2.4%.
The only category that continued to decline were Westside Townhouses with a -2.4% decline month-to-month.
Anecdotally, I'm seeing much stronger activity and interest levels with my own clients as well as on listings. Open houses are very active and sales are happening more quickly once again.
As always, if you need help navigating this complex market don't hesitate to reach out. I'm always here to help.



Comments:
Post Your Comment: