Three months ago this market looked like it was firmly stuck in neutral. February's numbers were soft, March was cautious, and even the spring surge in April and May was encouraging but incomplete. June adds another piece to what is becoming a more consistent picture: this market is healing, slowly and unevenly, but the direction of travel is no longer in question.
The City Picture: Closing the Gap
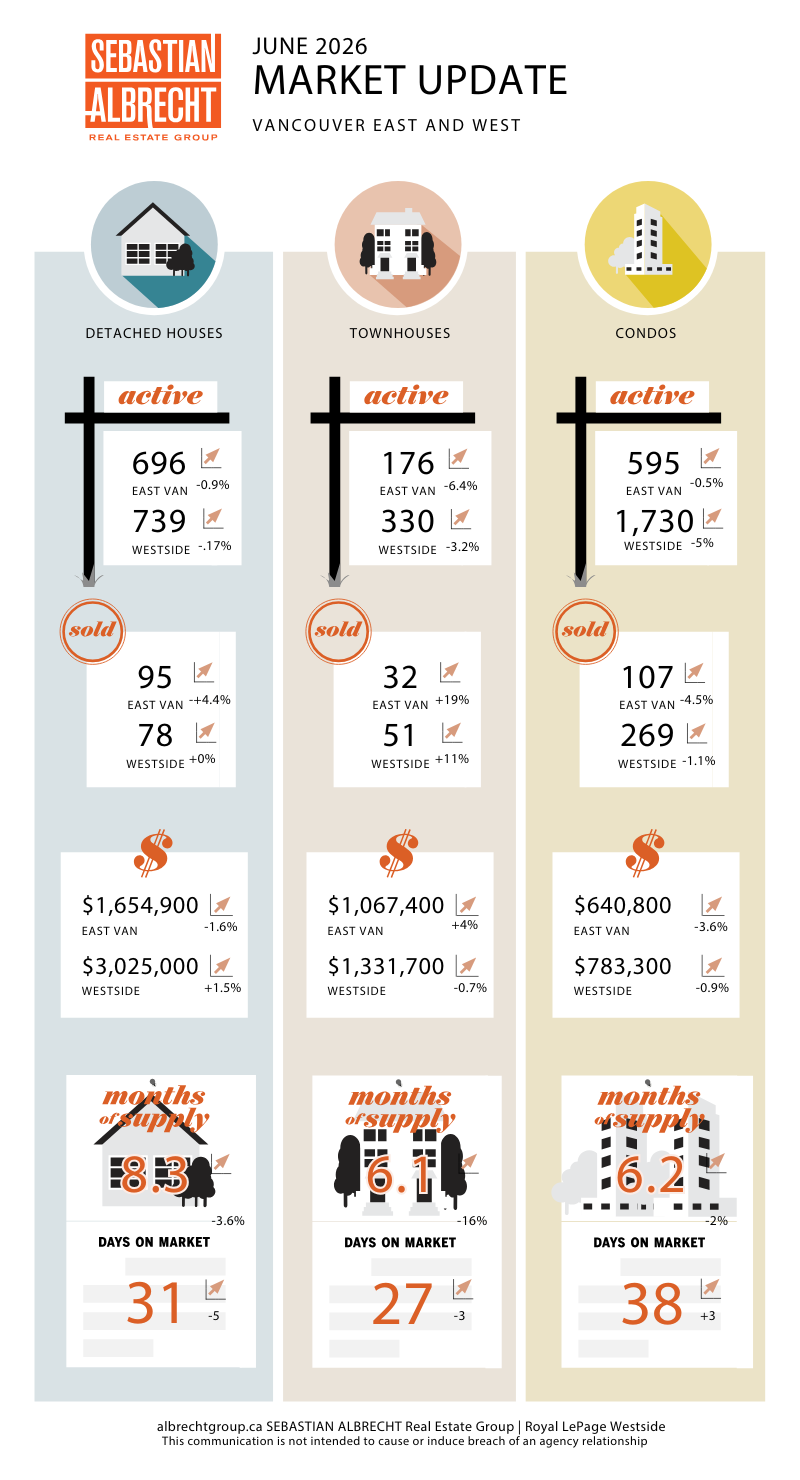
Total residential sales across Vancouver reached 708 in June 2026, up 3.7% from May and 3.1% higher than June 2025. That marks three consecutive months of year-over-year sales gains for the city, a streak we haven't seen since before the rate correction took hold.
The 10-year seasonal average for June sales in Vancouver is 786 transactions. At 708, we're now running approximately 10% below that long-term benchmark. That gap has narrowed meaningfully: back in February we were sitting nearly 30% below the 10-year average, and as recently as May we were still running 20.6% light. The improvement isn't...