
I don’t think it’ll surprise you if I said we were living in (suddenly) uncertain times. That uncertainty (driven by the threat of tariffs as well as rhetoric around the ‘51st State’) have had a significant impact on the Vancouver real estate market.
We were seeing a strengthening of demand at the tail end of 2024…strength that disappeared in the last couple of months. As a result, we have growing inventory and demand that’s well off of the typical pace at this time of year.
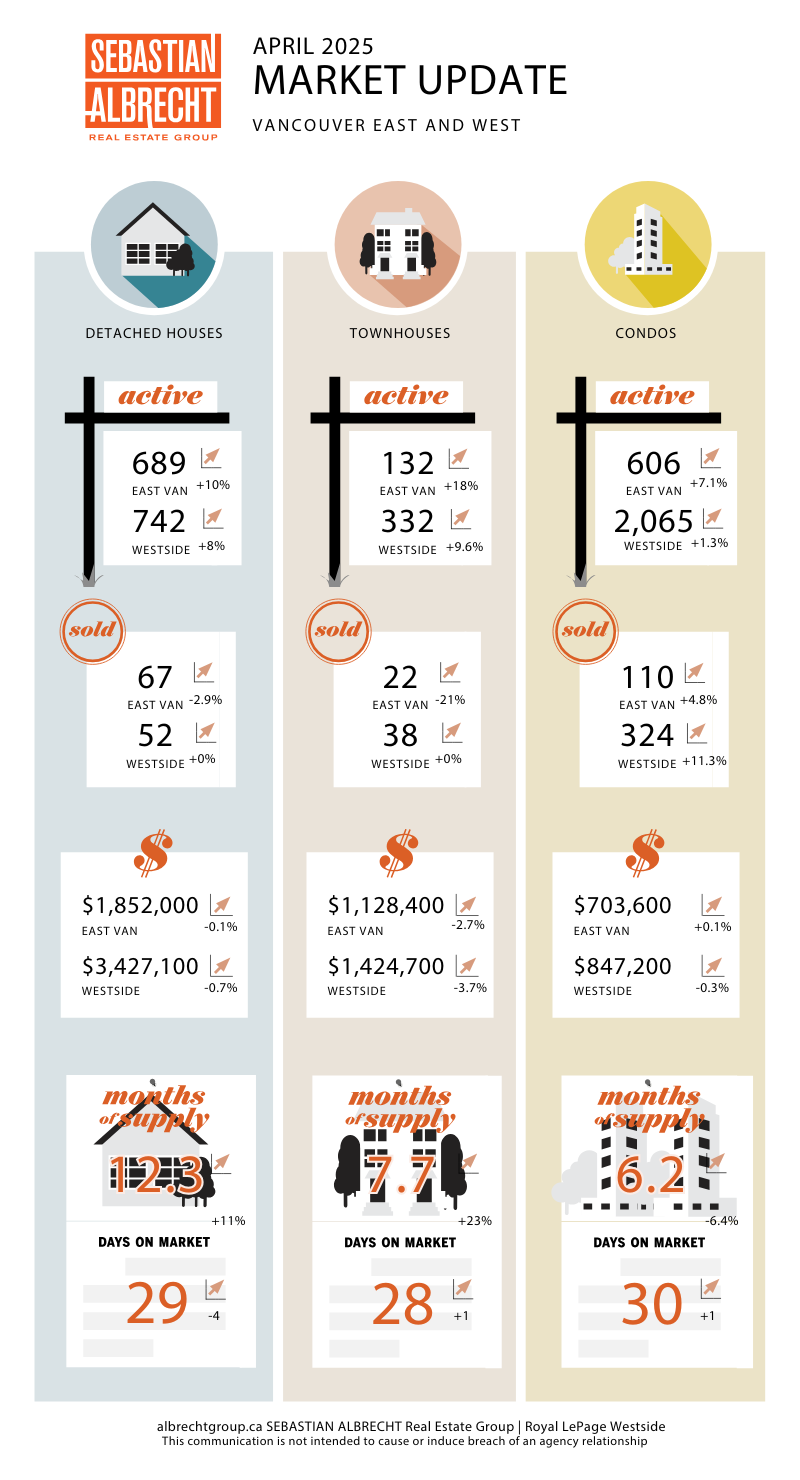
Sales rose to 642 in March which was up +25.9% from April but down -9.5% from last year. Most significantly, this was down -35.3% from the 10-year average and a low we haven’t seen in a March since 2019.
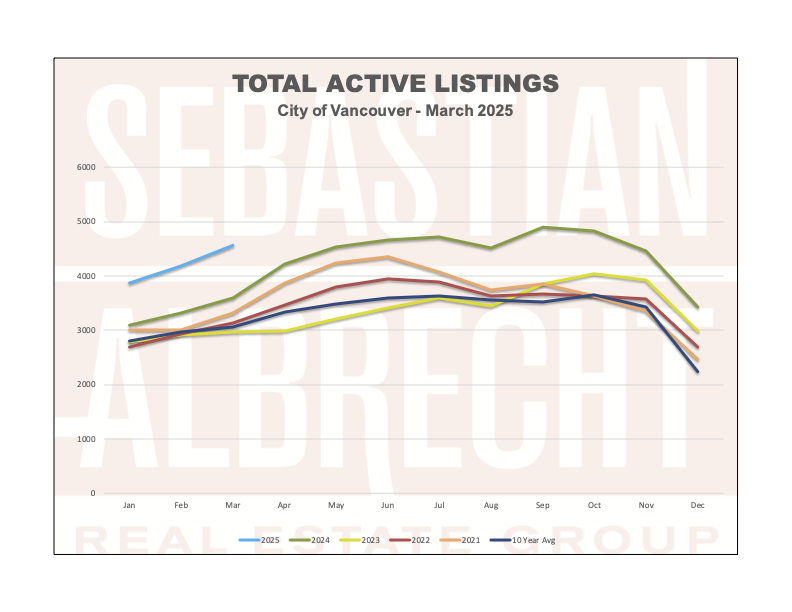
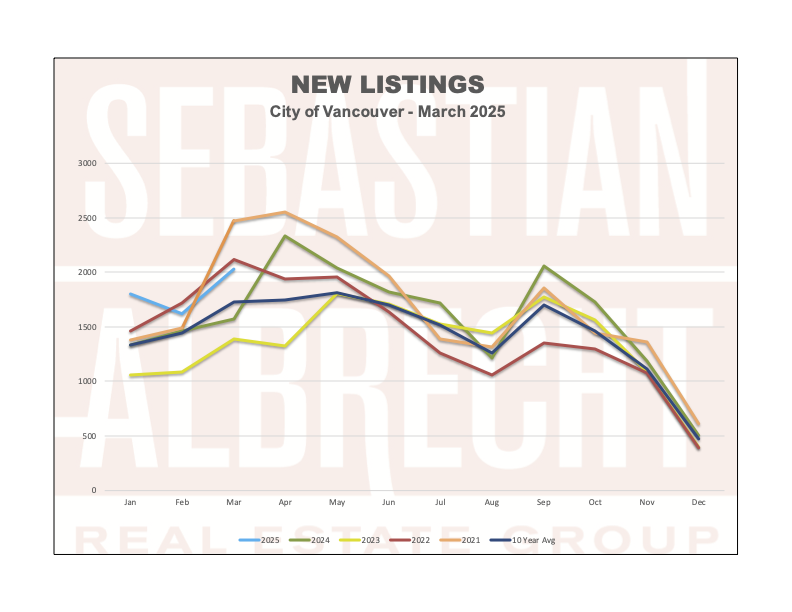
New Listings are growing and we saw 2,030 enter the market last month. This was +25.2% from last month and +28.8% from a year ago as well as +17.3% over the 10 year average. Total active listings rose to 4,561 which was nearly 50% over the 10 year average.
With demand falling and supply rising, we would expect to see prices fall. However, this has not been the case. In fact, home prices in Vancouver have been surprising many observers of the market as they remain stubbornly sticky to the peak we saw in the spring of 2022.
Despite the main headlines we are also continuing to see good listings, priced well sell in competition and sometimes over their asking price. This is an indication that there IS demand but only for the right kind of property and people will step into the market when the right opportunity presents itself.
Where we go from here is just about anyone’s guess. If the uncertainty around tariffs is removed, I can see Vancouver’s market pick up VERY quickly. There is an abundance of deferred demand and that won’t hold off forever.
However, if we continue to get whipsawed with news and threats of tariffs, our current situation may continue (and could get worse if more significant global events occur)….
As always, feel free to reach out if you’d like to chat about how the current market conditions might impact your plans!


Comments:
Post Your Comment: