Our market continues to strengthen.
After nearly a year of weakening, we now have a second month of strength. And the momentum is building.
By no means are we back to unsustainable levels of market activity. In fact, by most measures activity is still below the 10-year average. BUT, the trend is that the differences are shrinking.
The market is no longer frozen by fear (as it was toward the end of last year) and optimism continues to build.
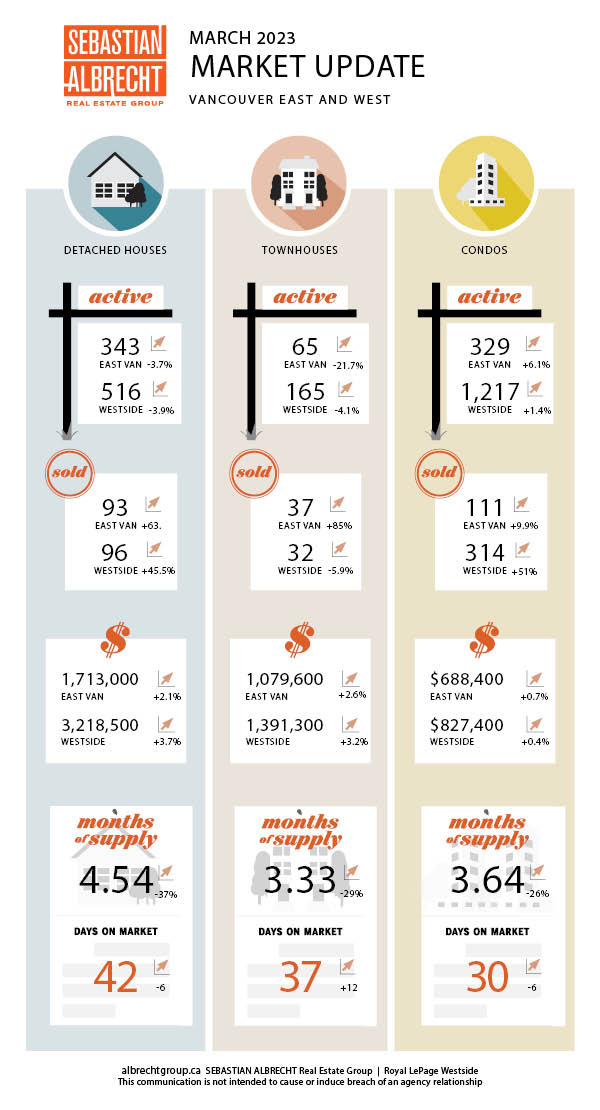
Sales jumped to 741. That's up +43.6% month-to-month but down nearly -43% from a year ago. This was down -27.5% from the 10-year average (1,022).
New listings increased to 1386 which was up +27.2% from last month and down -34.6% from a year ago. It was also down -17.5% from the 10-year (1679).
Active listings rose to 2824. This was just -1.2% off last month and down -10.1% from a year ago...but down -6.8% from the 10-year (3031).
So, demand is growing (sales) and supply (listings) continue to remain subdued. As a result, we are seeing a return to price...


