Enjoy our monthly newsletter filled with latest real estate news, tips, and facts. You can unsubscribe any time and we will not share your email address with others.
What NO ONE Tells You About Living In Vancouver
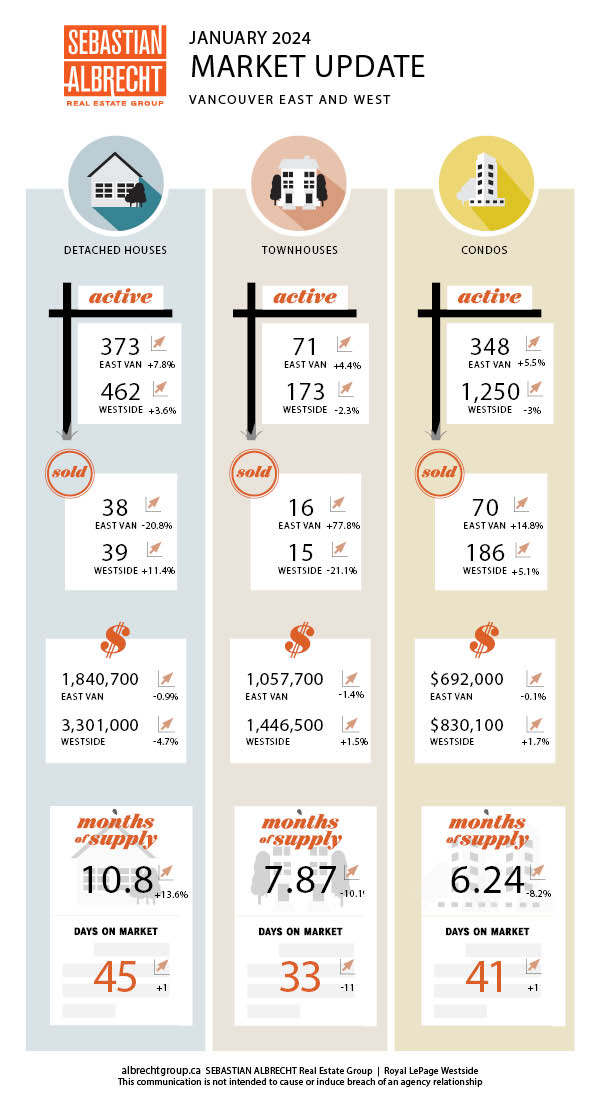
January 2024 – Monthly Vancouver Real Estate Update

So things turned a little positive in 2024.
As I've been talking about in recent months, the winter is usually the slowest period in Vancouver's real estate market. We typically see the lowest amount of activity mid-November through to the end of January.
However, THIS past January bucked that trend a little. What's normally our slowest month of the year actually saw a jump in activity not just in comparison to December 2023 (month to month) but also a very significant increase over January 2023 (year over year).
Sales rose to 412 (from 382). That's a +7.9% increase from last month and a whopping +31.6% increase over a year ago. Notably, it's still -16.4% below the 10-year average for the month of January.
New listings rose a whopping 236% over the month to 1,339. This was up +26.2% from a year ago. To put it into context this was up just +2.9% over the 10-year average.
And despite a big jump in new listings, active listings remained fairly stable. This number rose by just +0.8% to 2,897...
Vancouver’s Coolest Neighborhood – [Full VLOG Tour of Mount Pleasant]
December 2023 – Monthly Vancouver Real Estate Update

But as mentioned last month, this is normal market activity at this time of year. There's (almost) always a sharp decline of activity through the end of the year as most of us focus on family, vacations and holidays.
This year was no exception, but activity levels did fall sharper than we would usually see...with levels falling well below the 10-year average.
Sales fell to 382. This was down -22.2% from last month (but up +3.5% from last year) and off a whopping -31.9% from the 10-year average.
New Listings dropped to 398, down -63.3% from last month (but up +1.5% from a year ago). This was down -16.5% from the 10-year average.
This combined for a total of 2,735 Active Listings in Vancouver at the end of December. Up +24.7% over the 10-year average but down -24.5% from last month and up +1.82% from last year.
The result of softer...
November 2023 – Monthly Vancouver Real Estate Update

After a month of consolidation, Vancouver's real estate market softened once again in November. It turns out that October was a short lived reprieve from the pattern we've seen over the last six months.
This isn't a shock. As I mentioned in last months market review, we typically see things pullback from November through to February. So it comes as no surprise that this past month was light on market activity.
Sales (491) were down -15.3% from a month ago, but up +3.2% compared to a year before. That's a significant -32.8% below the 10-year average.
New listings reached 1,083 off -30.7% compared to last month and +0.7% from last year. It was also almost right on the 10-year average up +0.25% while Total Active Listings jumped to 3,620 which was +10.3% over the 10-year average.
As demand has eased off over the last few months we've seen prices slide. This month, every housing type across the city saw price declines except one. The most significant declines were for Westside Townhouses and Eastside...
The pros and cons of living in Dowtown Vancouver - Moving to Vancouver
Living in downtown Vancouver, BC is a topic thoroughly explored in this insightful YouTube video titled "The Pros and Cons of Living in Downtown Vancouver - 2023." The discussion revolves around the advantages and drawbacks of residing in the heart of Canada's most densely populated city.
Pros:
1. Central Location and Commute:
- Downtown Vancouver's central location is a major advantage, allowing for easy commutes to various parts of the city.
- The city has organically grown around this central point, providing convenient access in all directions through well-connected arterials.
2. Urban Amenities:
- Downtown Vancouver boasts a plethora of urban amenities, including bars, restaurants, nightlife, music venues, and renowned shopping destinations like Pacific Center and Robson Street.
- Proximity to work is a significant benefit for many residents.
3. Nature and Walkability:
- Nature is a big pro, with Stanley Park and David Lamb Park bordering downtown Vancouver.
- The city is known for its high walk...
Vancouver vs Victoria - WHICH CITY IS BETTER?
Vancouver vs Victoria - WHICH CITY IS BETTER?
Are you thinking of moving to or relocating to Vancouver, BC...but you've also heard great things about living in Victoria, BC? Vancouver or Victoria?
I know that it can be a really tough choice. And that's why I created this video...to give you a really thorough and comprehensive overview of the differences between two beautiful cities with so much to offer.
In this video I cover all aspects of living in Vancouver and Victoria, including geography, climate, demographics, culture, cost of living, transportation, housing, and the economy. I also cover my personal pros and cons of living in Vancouver as well as living in Victoria.
There are some HUGE differences in living in Vancouver, BC or Victoria, BC and before you move here or to the wrong city learn which part of southwestern BC is the perfect fit for you to move to and live.
If you have any questions or topics that you'd like to have me cover, be sure to leave a comment. I'm always available...
October 2023 – Monthly Vancouver Real Estate Update

September 2023 – Monthly Vancouver Real Estate Update

We had 531 sales in Vancouver in September 2023. This was -22.7% from August but up +10.6% from a year ago. It was also down a resounding -31% from the 10-year average...continuing a trend that started back in July of this year.
It was back in July, just after the first "surprise" interest rate hike were we first started to see demand falter after a very strong first half of 2023. This is now 3 months in a row that we've had successive declines on the demand side of housing in Vancouver.
Meanwhile, supply has been growing.
There were 1,777 new listings (+22.8 m-to-m and +31.4% y-to-y) along with 3,642 total active listings. Total listings were up +8.4% from the previous month but importantly remain right around the 10-year average (-0.7%).
So supply has steadily increased through the year, but not to unusual levels. But with supply increasing and a pullback in demand we are seeing pressure on prices finally easing up.
Most housing types across the city were either flat or down slightly....
Signup for our newsletter
STAY UP-TO-DATE WITH THE LATEST NEWS AND TIPS
As seen in:


