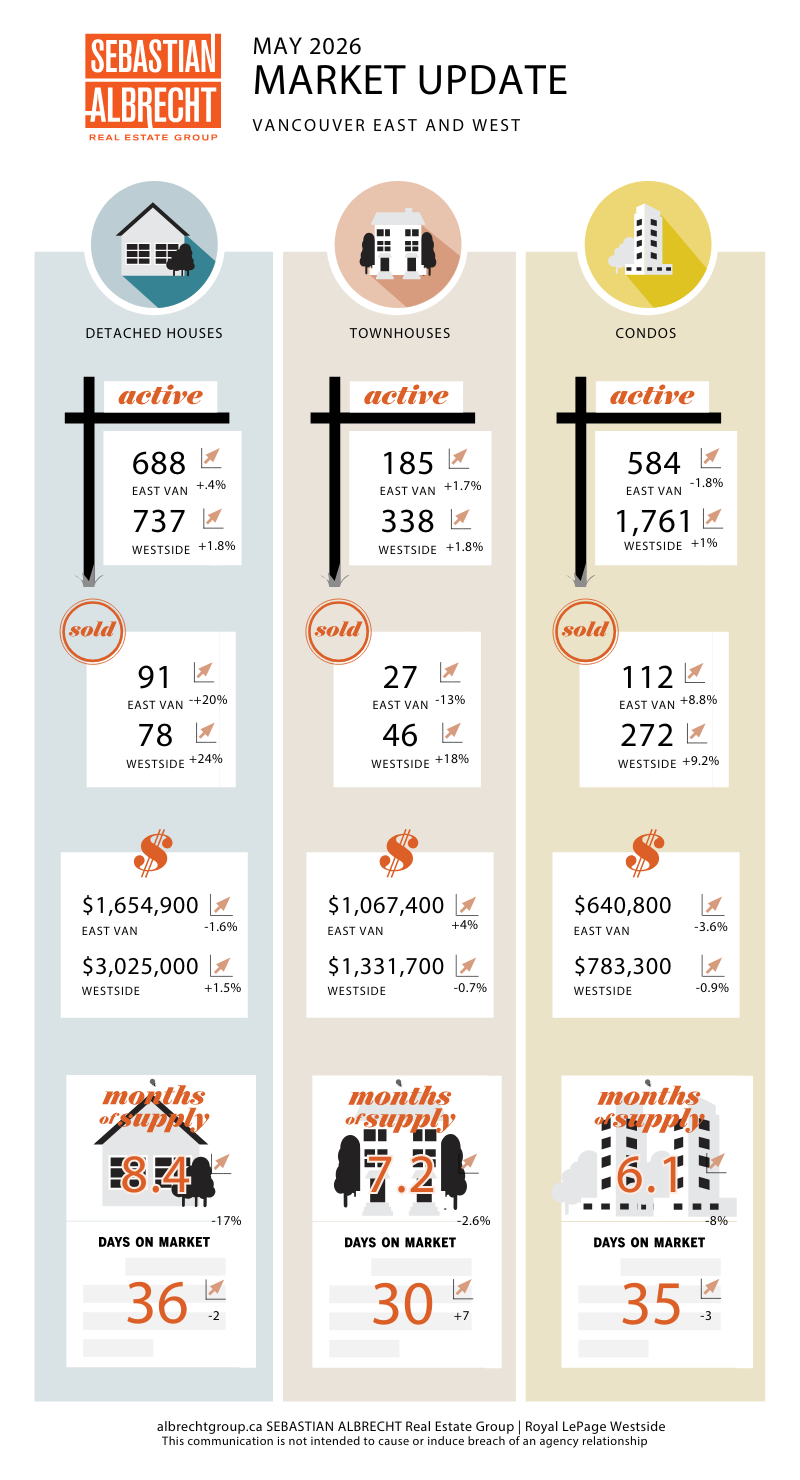
Vancouver's market is sending a genuinely mixed set of signals as we move through the peak of the spring season. Sales ticked higher in May, prices held steady across most segments, and yet the headline numbers remain well below what this city has historically produced at this time of year.
The City Picture: A Quiet Spring Thaw
Total residential sales across Vancouver reached 683 in May 2026, a 9.5% increase from April and a 4.4% gain year-over-year. But context matters. The 10-year seasonal average for May sales is 861 transactions, meaning we're running approximately 20.6% below that long-term benchmark. The spring market is arriving, just softly.
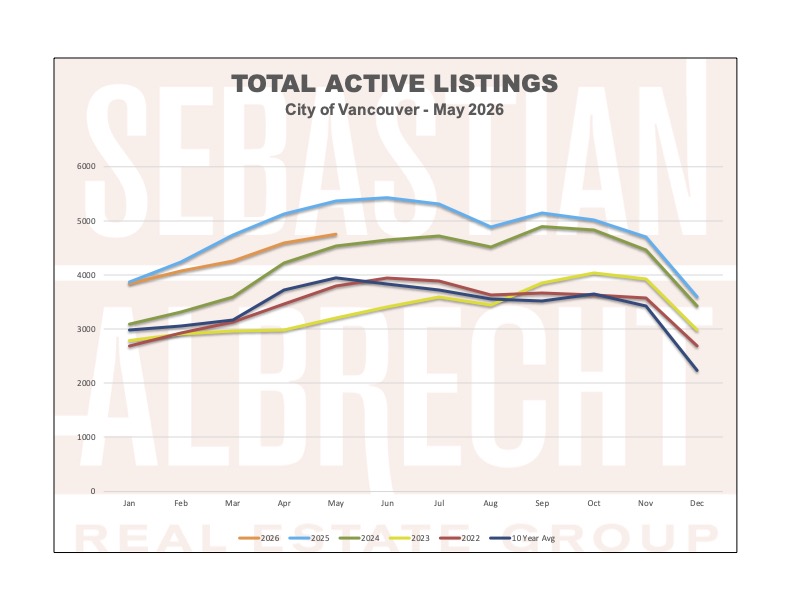
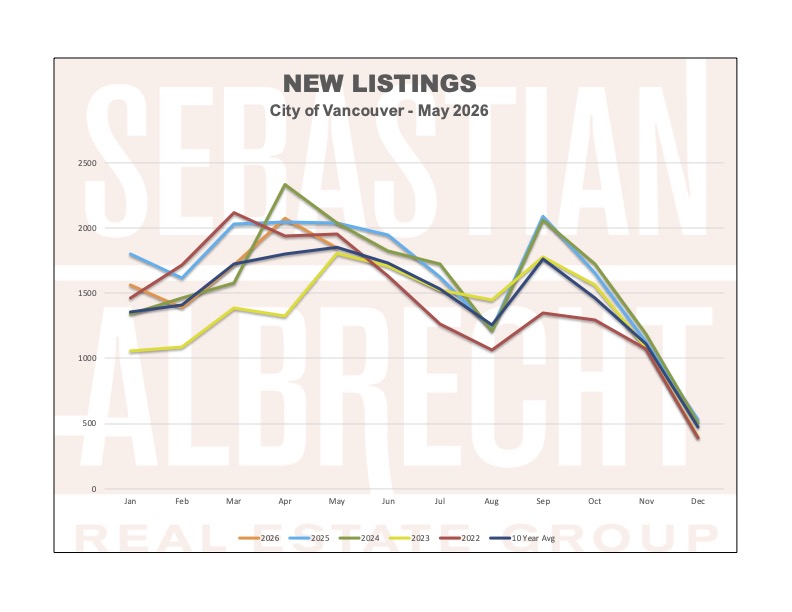
New listings are a different story. Sellers brought 1,845 new listings to market in May, essentially matching the 10-year May average of 1,853. Seller confidence hasn't collapsed; supply is coming to market at normal seasonal rates. The problem is buyers haven't kept pace. With total active listings at 4,754 citywide and running 20.4% above the 10-year average, negotiating power continues to favour the buyer. Months of supply has tightened to 6.9 months and the sales-to-active ratio sits at 14.4%, both improvements from earlier in the year, but neither yet reflecting a balanced market.
Vancouver West: The Detached Segment Quietly Stirs
The standout number this month comes from the West Side detached segment. Single-family home sales came in at 78 transactions, a 47.2% jump year-over-year. Some of that reflects a soft comparison base from a year ago when the market was in a deep freeze, but the direction is clear: buyers are beginning to act in a segment where prices have pulled back considerably from their peak.
The West Side detached benchmark sits at $3,025,000, up 1.5% from April but still 9.7% below a year ago. That year-over-year discount continues to attract buyers with long-term conviction. Months of supply came in at 7.25, down from over 8 in April, and total West Side active inventory of 3,000 listings is down 15.7% year-over-year, slowly tilting conditions back toward equilibrium.
Detached Benchmark: $3,025,000 (↑ 1.5% MoM | ↓ 9.7% YoY)
Townhouse Benchmark: $1,331,700 (↓ 0.6% MoM | ↓ 5.6% YoY)
Condo Benchmark: $783,300 (↓ 0.9% MoM | ↓ 6.8% YoY)
West Side total sales reached 414 across all property types, up 12.8% month-over-month and essentially flat year-over-year (+1.2%).
Vancouver East: Resilience Across the Board
The East Side continues to perform with consistency. Total sales came in at 269, up 4.7% from April and 9.8% higherthan May 2025, the second consecutive month of positive year-over-year growth. The detached segment was particularly active with 91 houses sold, a 26.4% jump year-over-year.
The East Side house benchmark sits at $1,654,900, down 1.6% from April and 9.7% below a year ago. Relative affordability at the entry level of the detached market continues to attract owner-occupier buyers focused on value. At 6.5 months of supply and active listings down 3.4% year-over-year, the East Side is the tightest sub-market in the city right now.
Detached Benchmark: $1,654,900 (↓ 1.6% MoM | ↓ 9.7% YoY)
Townhouse Benchmark: $1,067,400 (↑ 4.0% MoM | ↓ 3.7% YoY)
Condo Benchmark: $640,800 (↓ 3.6% MoM | ↓ 7.9% YoY)
The Broader Benchmark: Prices Are Finding a Floor
Combined Detached Benchmark: $2,339,950 (↑ 0.4% MoM | ↓ 9.7% YoY)
Combined Townhouse Benchmark: $1,199,550 (↑ 1.4% MoM | ↓ 4.7% YoY)
Combined Apartment Benchmark: $712,050 (↓ 2.1% MoM | ↓ 7.3% YoY)
Across the combined city, detached sales hit 169 transactions, up 35.2% year-over-year, a strong signal that buyers are recalibrating to the new price reality. Apartment sales at 384 transactions were effectively flat year-over-year (-2%), while townhomes produced 73 sales, down about 10% from May 2025. The condo segment bears watching. With 2,345 active apartment listings citywide, down 19.1% year-over-year but still elevated, the path back to a balanced condo market will take more time.
What This Means For You
The key takeaway from May is that the market is no longer deteriorating. Sales are picking up, months of supply is compressing, and detached prices appear to be putting in a base. New listings tracking almost exactly in line with the 10-year average tells us sellers haven't abandoned the market; they're pricing more realistically and accepting that 2021-era transaction volumes aren't coming back.
For buyers, the window of maximum negotiating leverage may be narrowing. Active inventory fell 11.6% year-over-year citywide and months of supply continues to trend lower. June and July traditionally represent peak listing supply, so the next 60 days could be the last opportunity to shop a broadly supplied market before inventory tightens into the fall.
For sellers, correctly priced properties are moving. House sales in both Vancouver East and West posted strong year-over-year gains. Buyers who have been sitting on the sidelines are starting to act, and they are disciplined. Overpriced listings continue to sit; thoughtfully positioned ones are finding takers.
If you'd like to understand what these numbers mean for your home or your search, reach out and I'm happy to dig into the details.




 The data relating to real estate on this website comes in part from the MLS® Reciprocity program of either the Greater Vancouver REALTORS® (GVR), the Fraser Valley Real Estate Board (FVREB) or the Chilliwack and District Real Estate Board (CADREB). Real estate listings held by participating real estate firms are marked with the MLS® logo and detailed information about the listing includes the name of the listing agent. This representation is based in whole or part on data generated by either the GVR, the FVREB or the CADREB which assumes no responsibility for its accuracy. The materials contained on this page may not be reproduced without the express written consent of either the GVR, the FVREB or the CADREB.
Comments:
Post Your Comment: