Three months ago this market looked like it was firmly stuck in neutral. February's numbers were soft, March was cautious, and even the spring surge in April and May was encouraging but incomplete. June adds another piece to what is becoming a more consistent picture: this market is healing, slowly and unevenly, but the direction of travel is no longer in question.
The City Picture: Closing the Gap
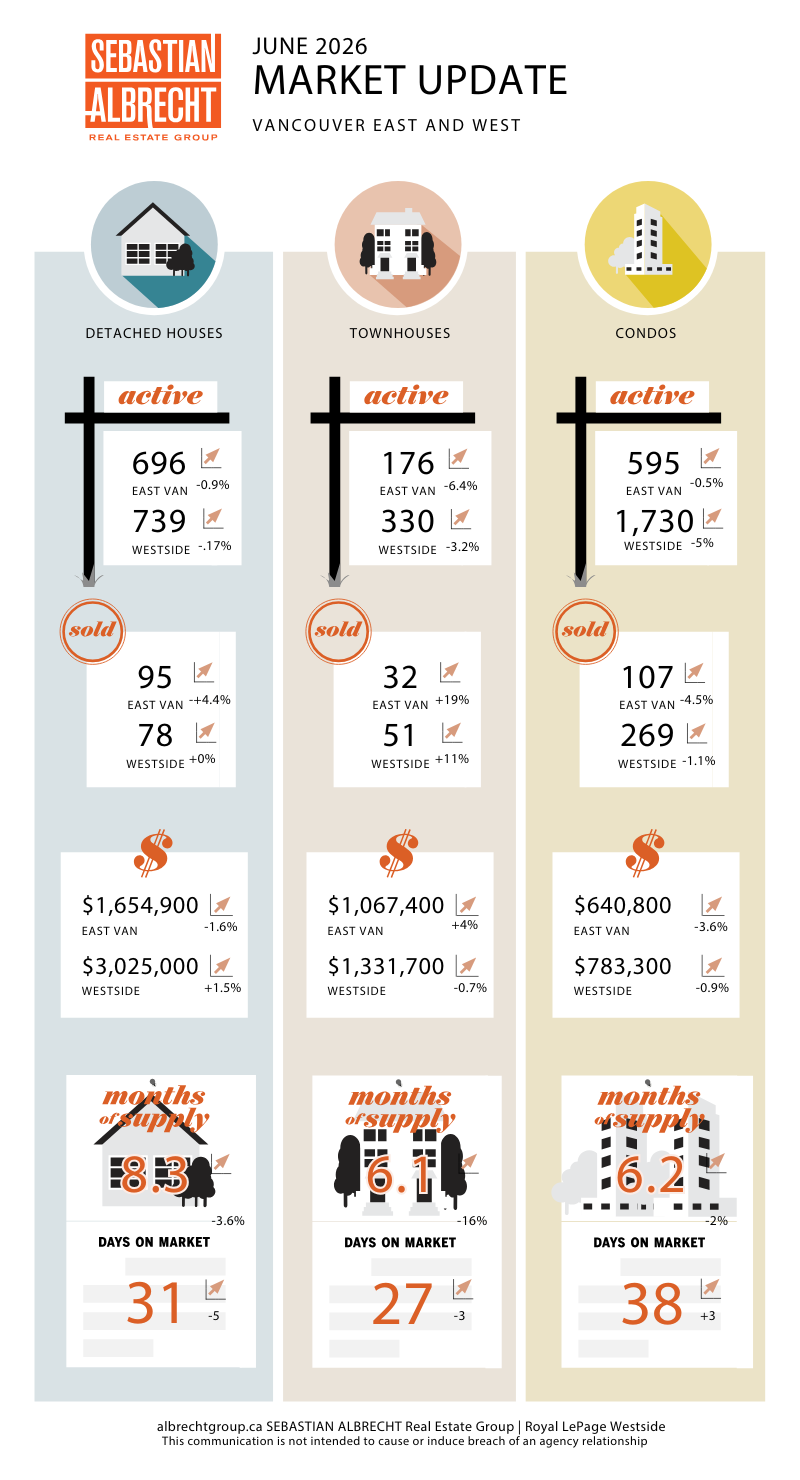
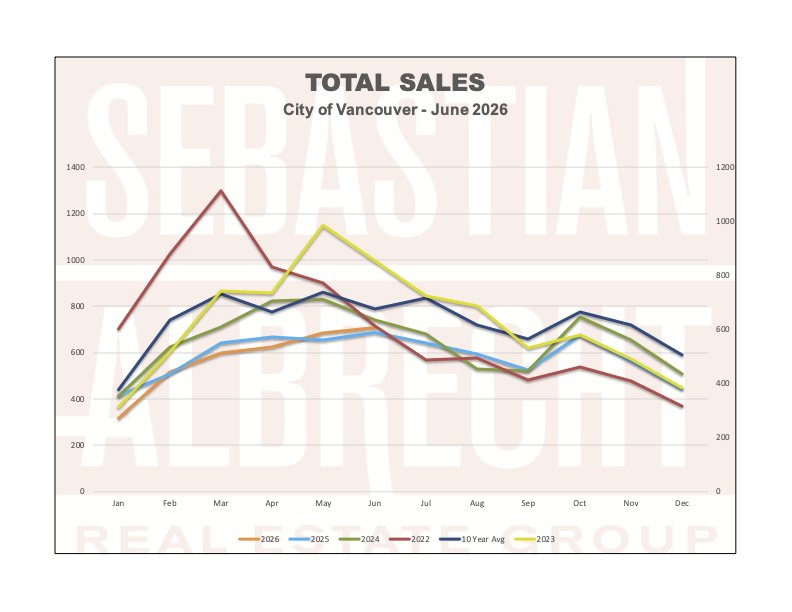
Total residential sales across Vancouver reached 708 in June 2026, up 3.7% from May and 3.1% higher than June 2025. That marks three consecutive months of year-over-year sales gains for the city, a streak we haven't seen since before the rate correction took hold.
The 10-year seasonal average for June sales in Vancouver is 786 transactions. At 708, we're now running approximately 10% below that long-term benchmark. That gap has narrowed meaningfully: back in February we were sitting nearly 30% below the 10-year average, and as recently as May we were still running 20.6% light. The improvement isn't dramatic, but the trend line is consistent.
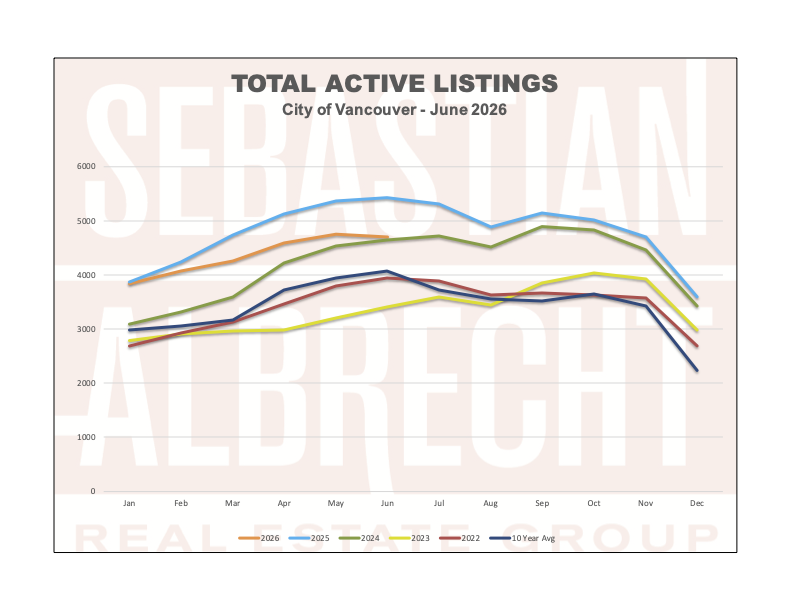
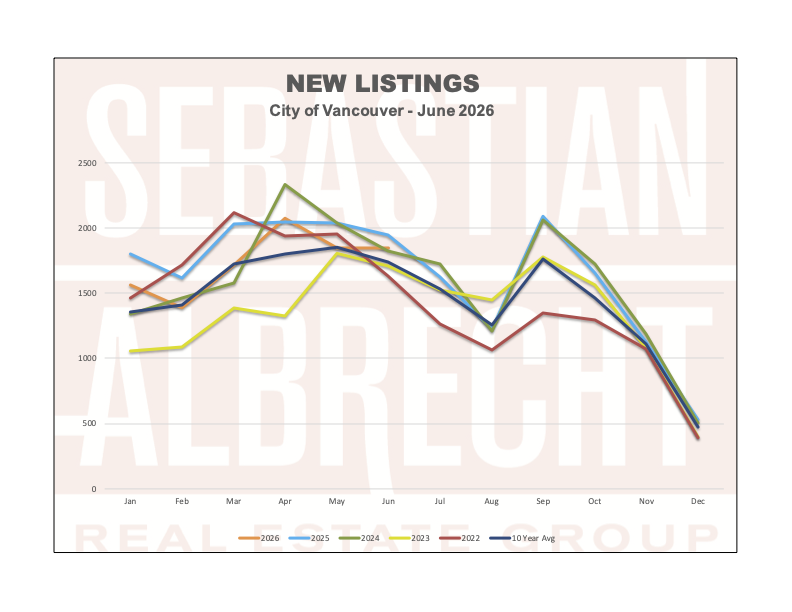
New listings came in at 1,846, essentially flat with May and running 6.1% above the 10-year June average of 1,741. Sellers are active, but unlike earlier in the year when new supply was piling onto an already bloated market, that supply is now being absorbed more efficiently. Total active listings citywide fell to 4,711, down 13.2% year-over-year and the first month active inventory has dipped below the 10-year June average of 4,074 by just 15.6% rather than the 20%-plus excess we saw through winter and spring. Months of supply compressed further to 6.6 months, down from 6.9 in May and well below the 8.8 months we recorded back in February.
Vancouver West: Inventory Relief, Prices Stabilizing
The West Side posted 420 total sales in June, essentially flat with May (+1.4%) and barely changed year-over-year (+0.2%). That stability in volume is actually a reasonable outcome given that we're now moving past the seasonal peak, and with months of supply at 7.0 months the West Side remains the softer of the two sub-markets.
What's notable is the continued compression in active inventory. Total West Side active listings came in at 2,957, down 16.8% year-over-year, the steepest annual decline we've recorded on this side of the city this year. Fewer competing sellers, combined with prices that have pulled back considerably from peak, is the setup that typically precedes a price stabilization, and that's what the benchmarks are starting to show.
The West Side detached benchmark reached $3,042,100, up a modest 0.6% from May and now sitting 9.2% belowJune 2025. Two months ago that year-over-year gap was sitting at negative 9.7%. It's a small move, but it's the right direction. West Side house sales came in at 78 transactions, up 13% year-over-year, consistent with the trend we flagged in May when detached demand began reasserting itself.
Detached Benchmark: $3,042,100 (↑ 0.6% MoM | ↓ 9.2% YoY)
Townhouse Benchmark: $1,351,600 (↑ 1.5% MoM | ↓ 5.4% YoY)
Condo Benchmark: $779,200 (↓ 0.5% MoM | ↓ 5.6% YoY)
Vancouver East: The Tightest Market in the City
The East Side continues to be the most balanced sub-market in Vancouver. Total sales came in at 288, up 7.1% from May and 7.5% higher than June 2025. Months of supply sits at 6.1 months, the lowest reading across any segment or sub-market in this report, and total active listings of 1,754 are down 6.4% year-over-year.
The East Side house benchmark edged up to $1,659,400, essentially flat month-over-month (+0.3%) and holding at 9.6% below a year ago. With 95 house sales in June, the detached segment on the East Side is transacting at a consistent pace, though the year-over-year comparison is roughly flat (-1%) given that June 2025 was already a stronger month for East Side houses specifically.
One number to watch: East Side new listings ticked up 9.4% from May, the only sub-market where supply increased month-over-month. That's worth monitoring, though at 770 total new listings it's not yet a concern.
Detached Benchmark: $1,659,400 (↑ 0.3% MoM | ↓ 9.6% YoY)
Townhouse Benchmark: $1,054,900 (↓ 1.2% MoM | ↓ 3.5% YoY)
Condo Benchmark: $637,300 (↓ 0.5% MoM | ↓ 7.2% YoY)
The Broader Benchmark: A Slower Descent
Combined Detached Benchmark: $2,350,750 (↑ 0.5% MoM | ↓ 9.3% YoY)
Combined Townhouse Benchmark: $1,203,250 (↑ 0.3% MoM | ↓ 4.6% YoY)
Combined Apartment Benchmark: $708,250 (↓ 0.5% MoM | ↓ 6.3% YoY)
The combined detached benchmark is now positive month-over-month for the third consecutive month. Small gains, but consistent ones. The year-over-year gap on houses has narrowed from a low of negative 12.2% in January to negative 9.3% today. Apartment prices continue to drift slightly lower, with the combined benchmark down 0.5% from May and still 6.3% below a year ago. Townhouses are holding in the middle: the combined benchmark is up 0.3% month-over-month, and the year-over-year gap of 4.6% is the smallest of any segment.
House sales across the combined city totalled 173 transactions, up 4.9% year-over-year and consistent with the accelerating detached demand we've been tracking since April. Townhouse sales came in at 83, up 13.7% from May. Apartment sales at 376 were down 3.3% year-over-year, though months of supply for condos at 6.2 months is actually tighter than the detached segment's 8.3 months, a reminder that the condo market's challenge right now is pricing rather than demand.
What This Means For You
The theme from February through April was: the market is not as bad as the headlines suggest, but it's not recovering yet either. The theme from May and June is different. We now have back-to-back months of positive year-over-year sales growth, active inventory declining at double-digit annual rates, and benchmark prices for houses that have stopped falling on a monthly basis.
That is not the same as saying prices are going up. They're not, not in any meaningful way, and year-over-year comparisons will remain negative for some time. But the market is finding its footing, and buyers who waited for the bottom to be confirmed are now looking at conditions that are measurably tighter than they were six months ago.
For buyers, the 10-year average gap on active inventory has compressed from roughly 20% above average in May to 15.6% above in June. That's still buyer-friendly, but the runway is shortening. If you're weighing a purchase decision, the data no longer supports the argument that waiting will produce materially better conditions.
For sellers, the lesson from the last three months is consistent: correct pricing works. Well-positioned properties at realistic values are closing. The sellers who continue to anchor to 2022 comparables are sitting on the market while their neighbors sell.
If you'd like to understand what June's numbers mean for your specific situation, reach out and I'm happy to work through the details with you.



 The data relating to real estate on this website comes in part from the MLS® Reciprocity program of either the Greater Vancouver REALTORS® (GVR), the Fraser Valley Real Estate Board (FVREB) or the Chilliwack and District Real Estate Board (CADREB). Real estate listings held by participating real estate firms are marked with the MLS® logo and detailed information about the listing includes the name of the listing agent. This representation is based in whole or part on data generated by either the GVR, the FVREB or the CADREB which assumes no responsibility for its accuracy. The materials contained on this page may not be reproduced without the express written consent of either the GVR, the FVREB or the CADREB.
Comments:
Post Your Comment: