July did what July almost always does. Sales pulled back from June's pace, months of supply ticked up, and the sense of momentum that characterized parts of the spring went quiet. None of that is surprising. The question every July is not whether volume falls from June (it always does) but where the numbers land relative to the same month in previous years, and relative to what this city has historically produced in the heart of summer.
The City Picture: A Seasonal Pause, Not a Reversal
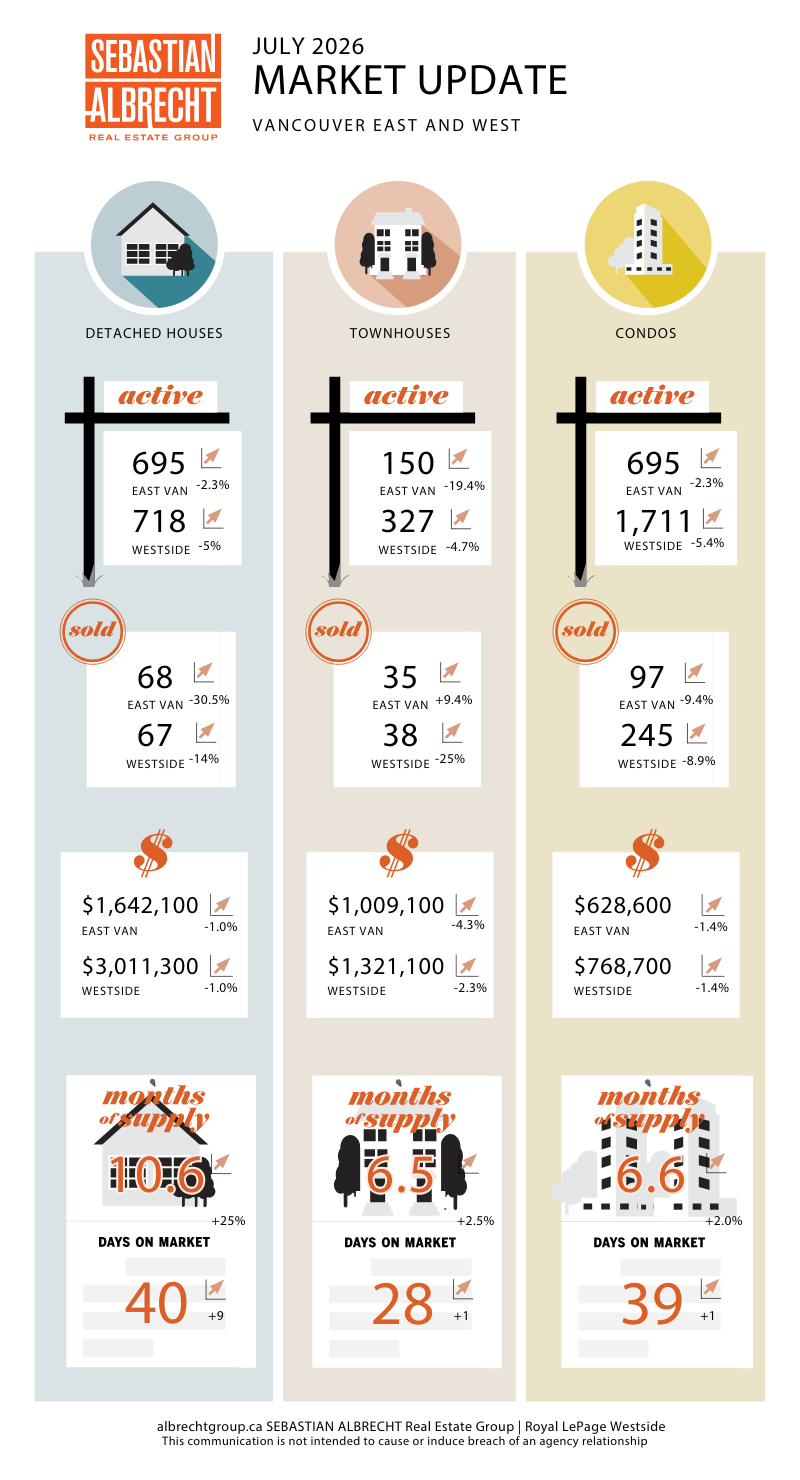
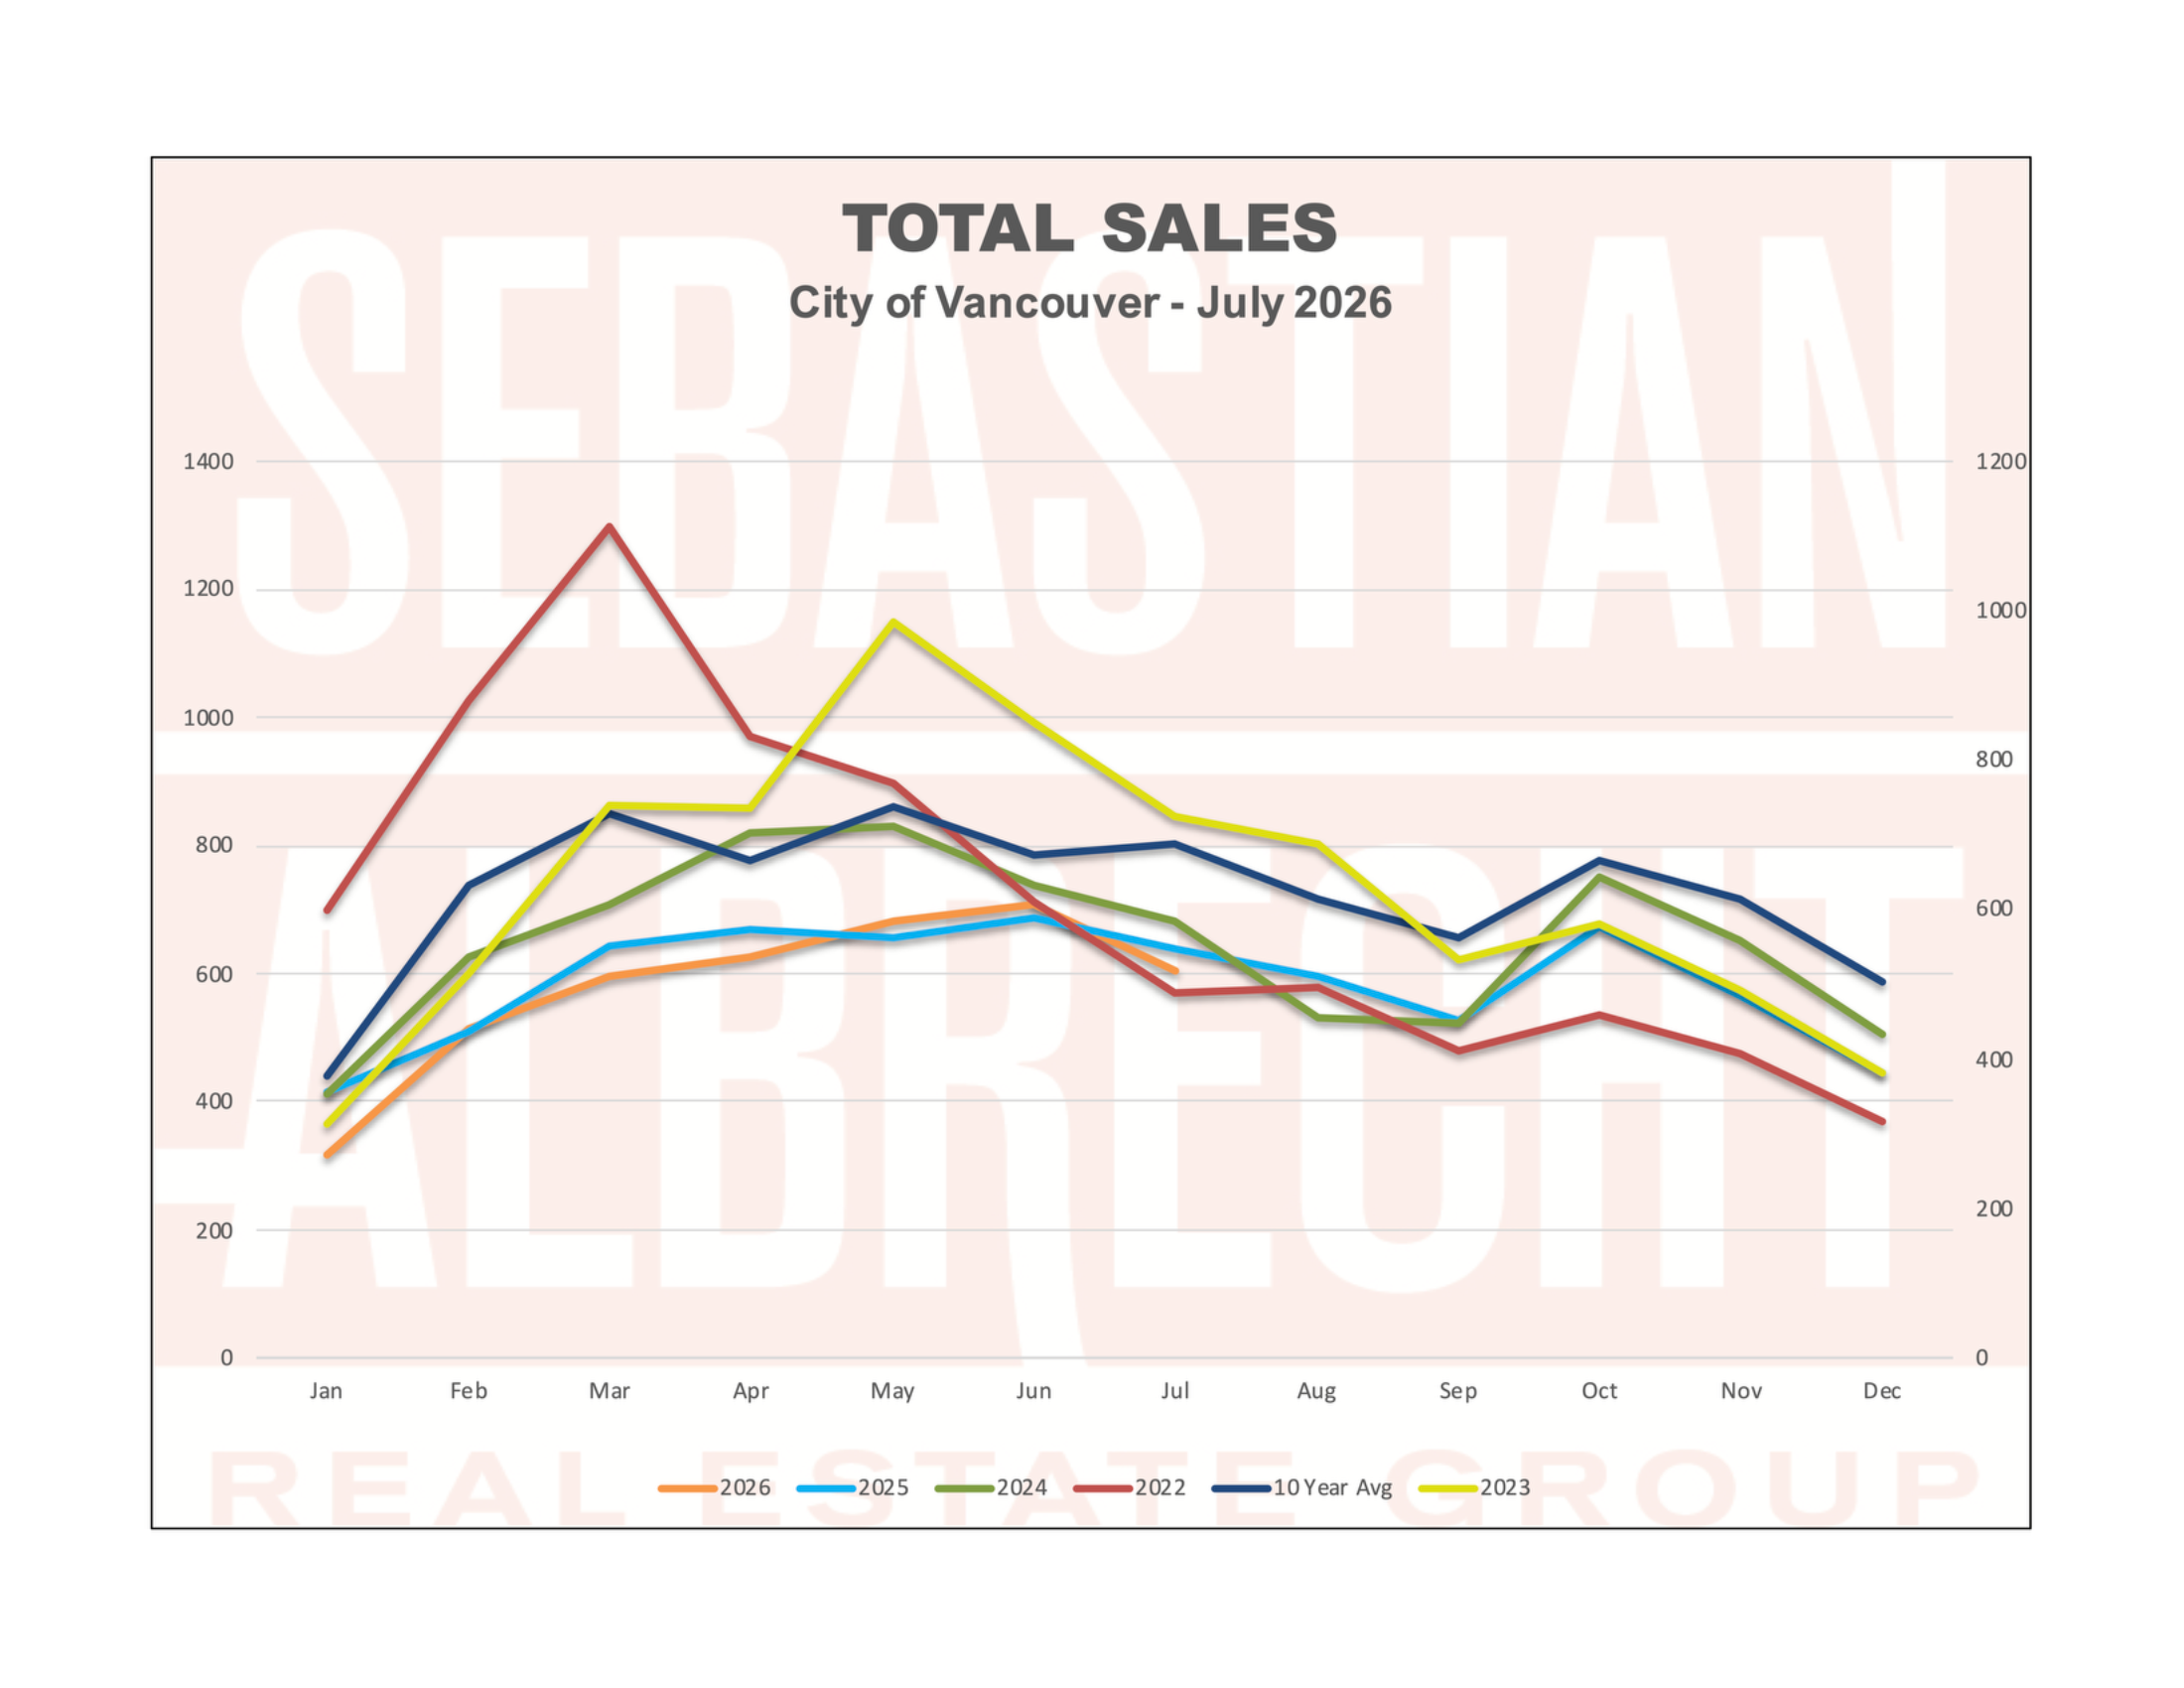
Total residential sales across Vancouver came in at 606 in July 2026, down 14.4% from June and 5.3% below July 2025. That year-over-year dip ends the three-month streak of positive annual comparisons we tracked through April, May, and June. Worth acknowledging, though it needs context. July 2025 was a reasonably active month in this city, so comparing against it is a tougher test than the soft year-ago numbers that made the spring figures look strong.
Against the 10-year seasonal average of 802 July sales, the city came in 24.4% light. That sounds like a step back from June's 10% gap, and on paper it is. But the summer 10-year bar is a high one because it includes the peak years of 2015 through 2017 and the pandemic-driven surge of 2021 and 2022. Stripped of those outlier years, July's performance is closer to the norm than the percentage gap implies.
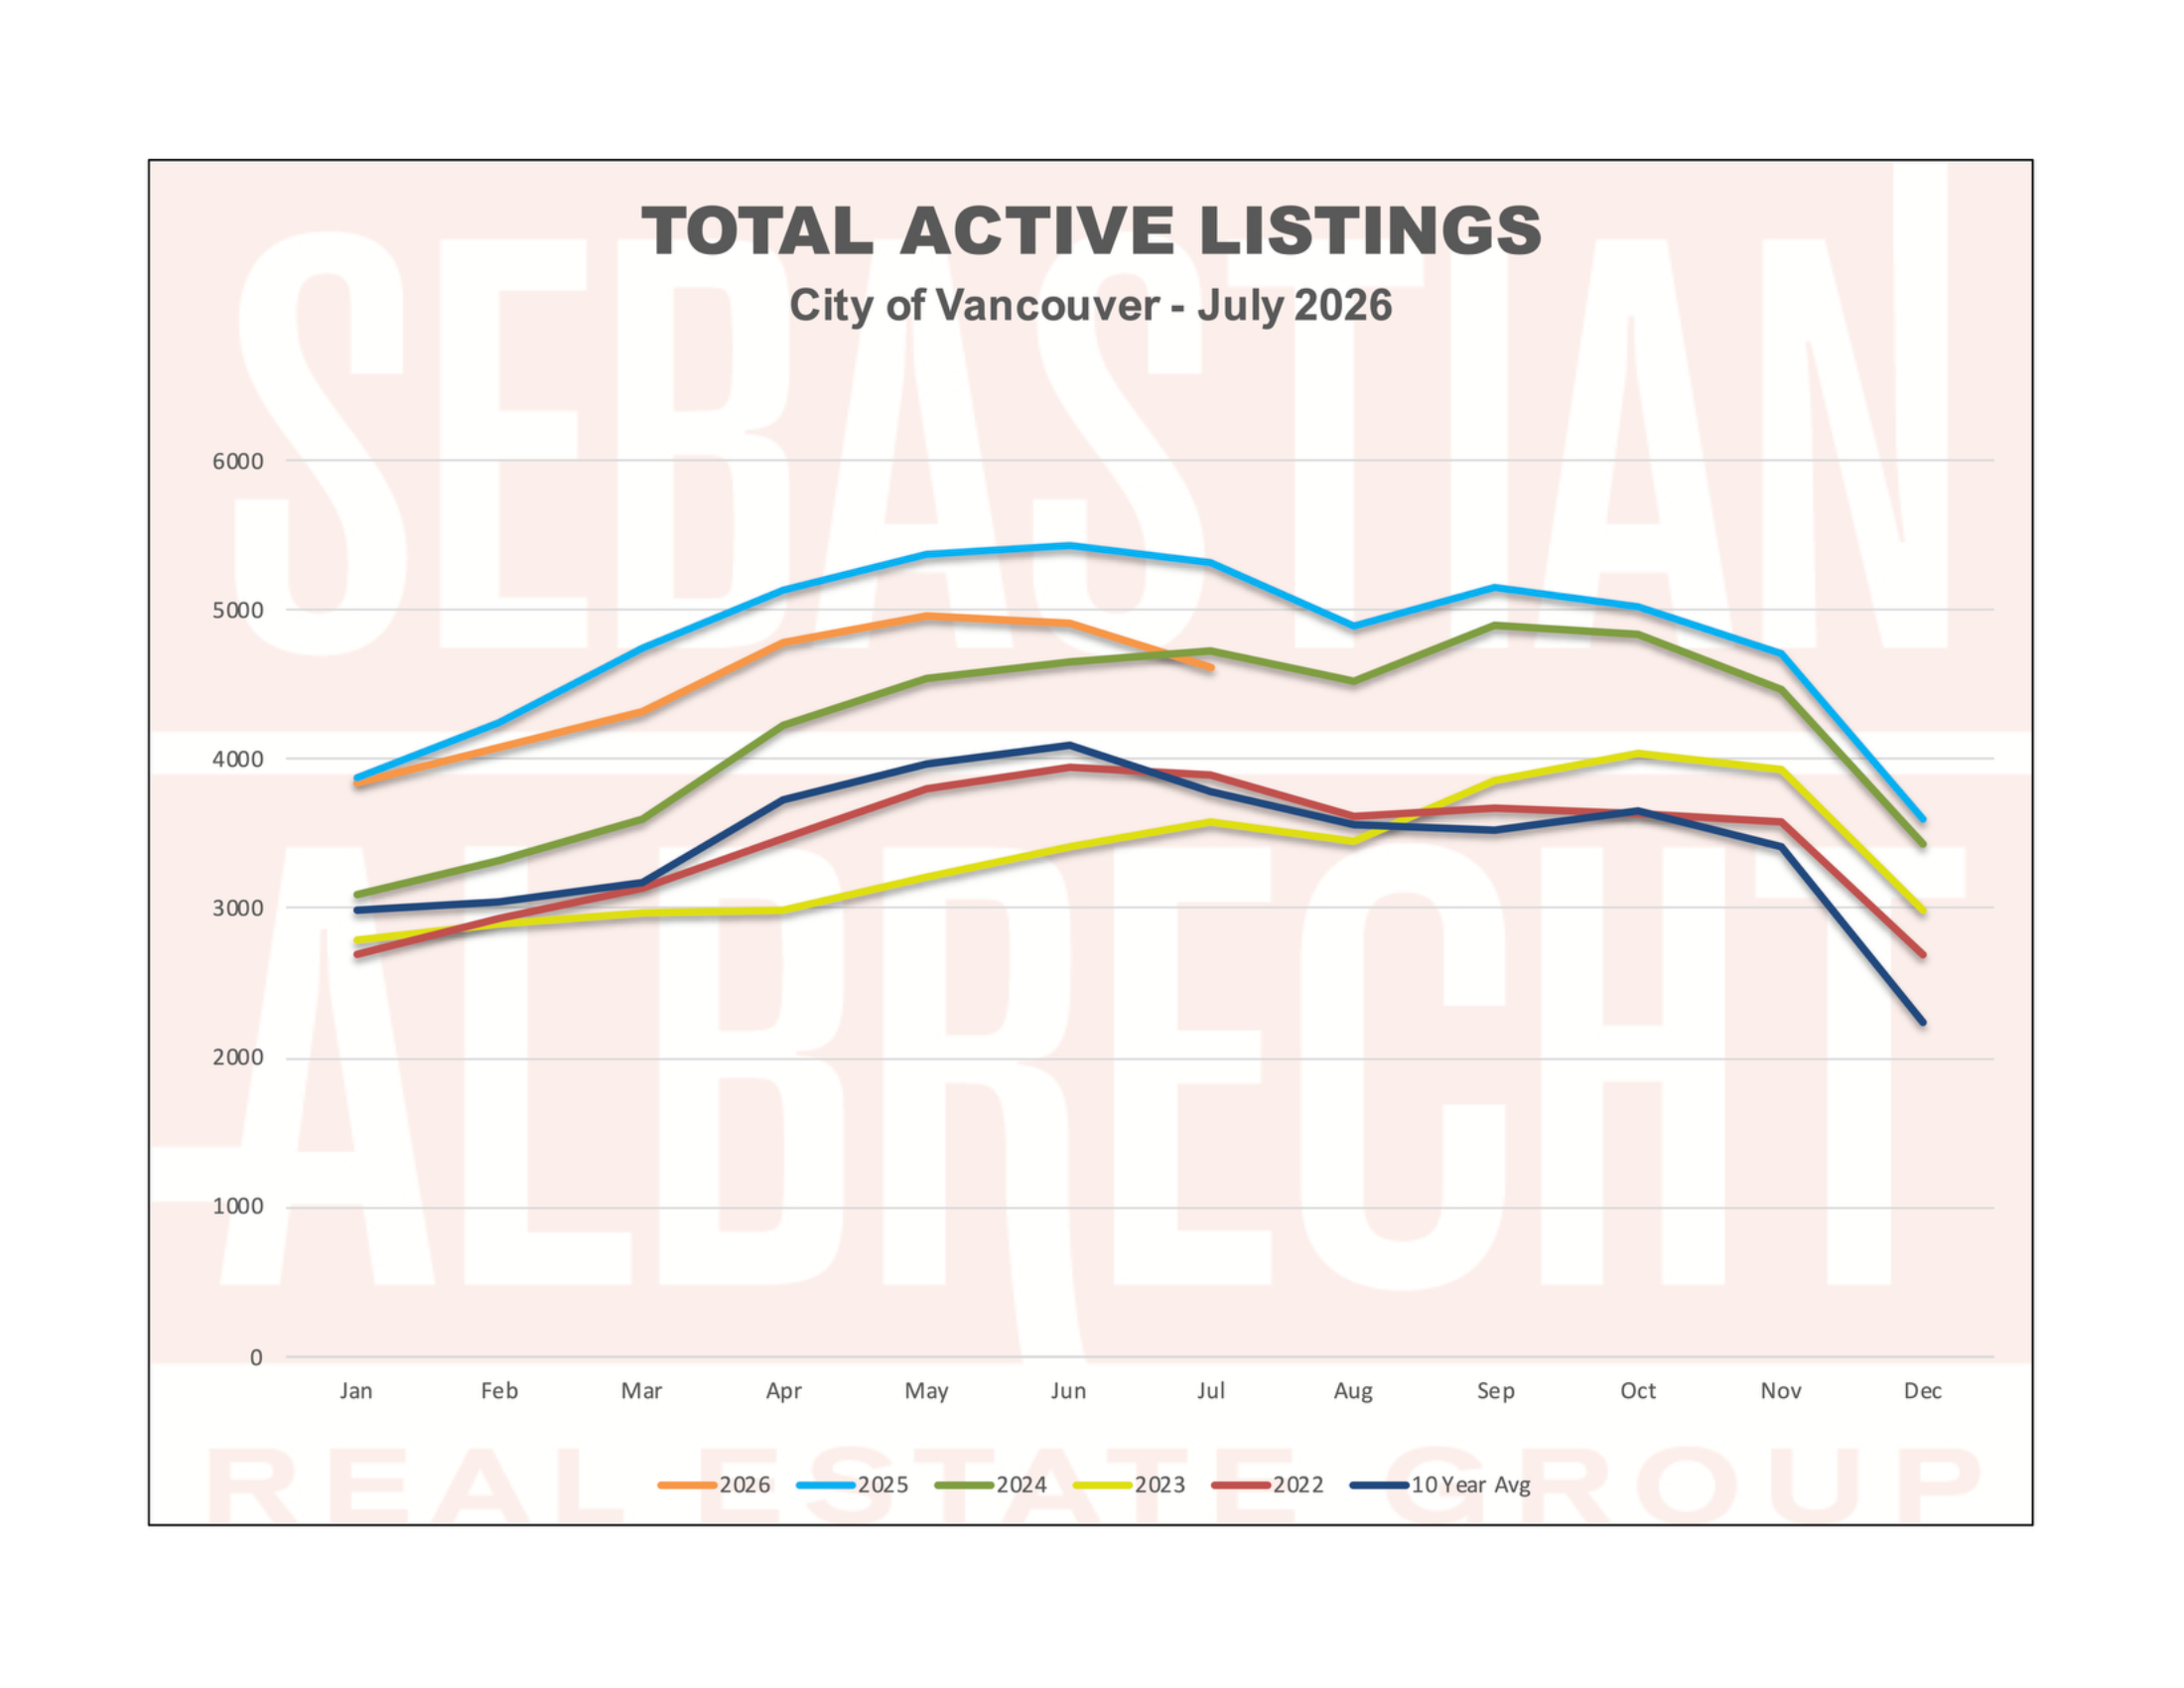
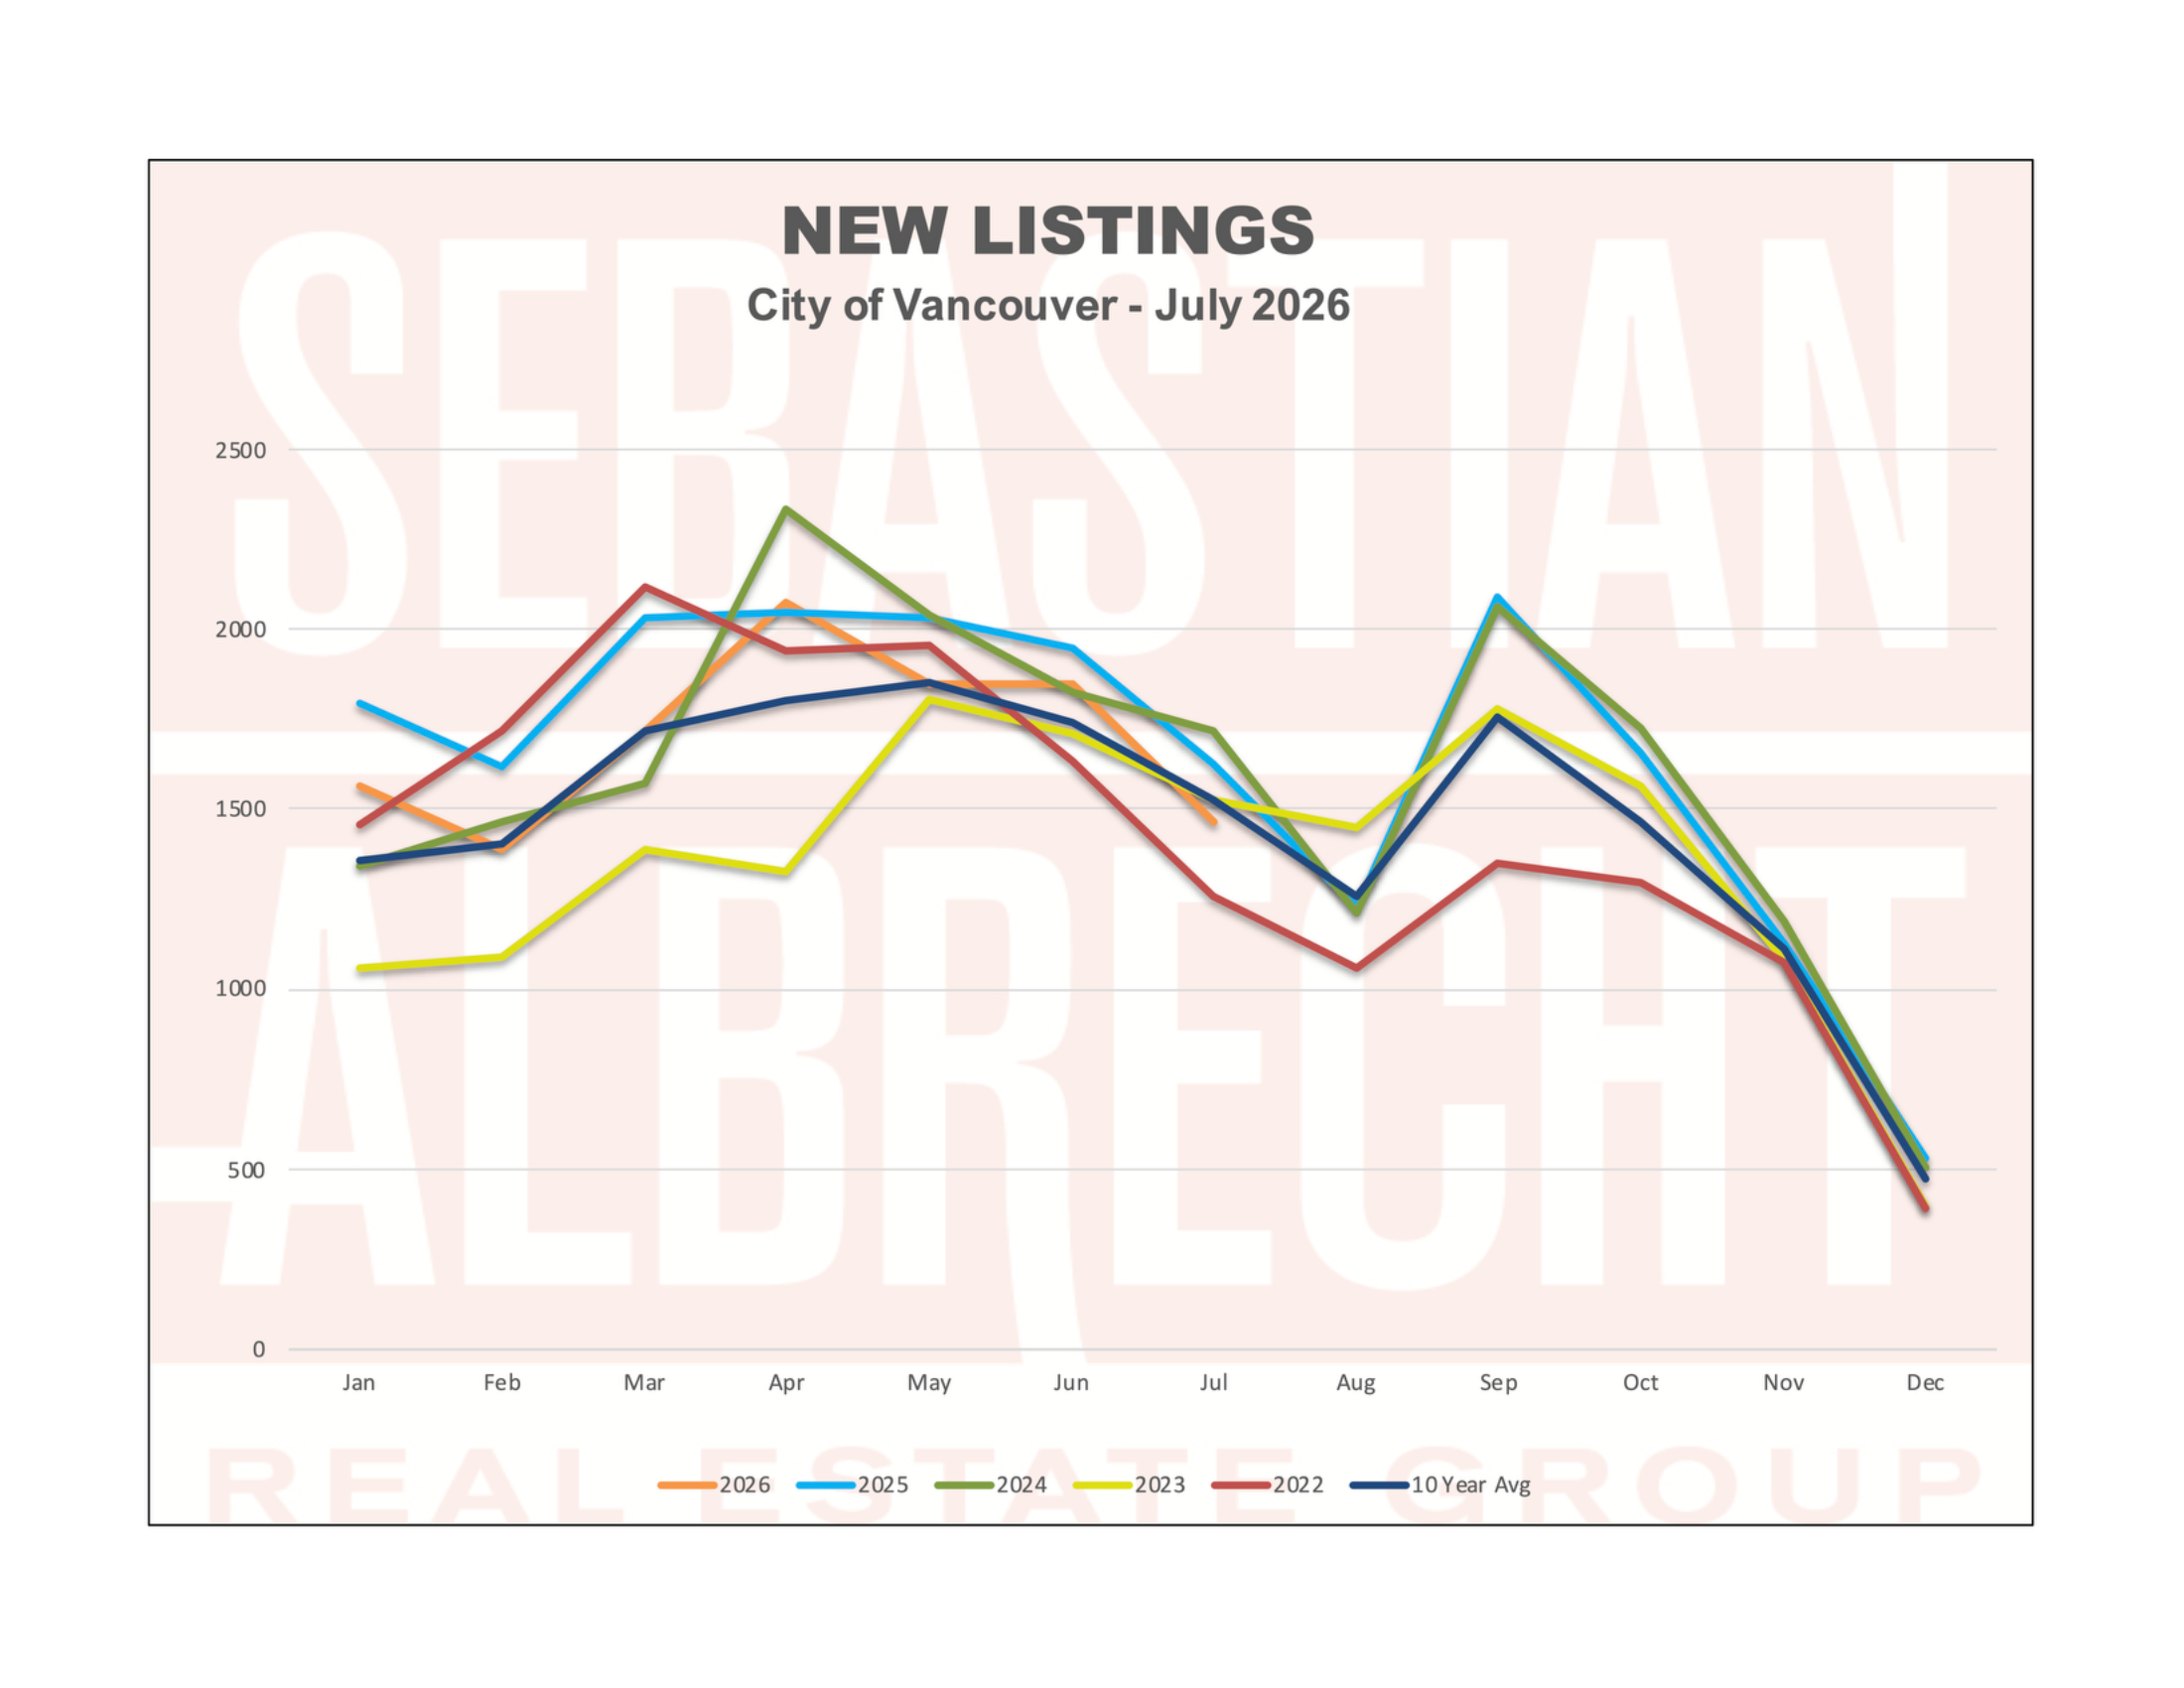
The supply side is where the more interesting shift happened. New listings dropped to 1,462, down 20.8% from June and running 4.5% below the 10-year July average of 1,530. For the first time this year, new supply came in below its long-term seasonal norm. Total active listings came in at 4,612, down 13.3% year-over-year and 22.1% above the 10-year average, still elevated, but down from the 20%-plus excess we were carrying through the winter and spring. Months of supply moved to 7.5, up from 6.8 in June, which is a normal seasonal pattern rather than a signal of anything structural.
Vancouver West: Prices Quietly Closing the Gap
The West Side posted 362 total sales in July, down 13.8% from June and 8.8% below July 2025. Active inventory came in at 2,921, down 15.7% year-over-year and continuing the steady compression in competing supply that has been a consistent theme since spring. Months of supply sits at 8.1, up from 7.3 in June.
The most significant development on the West Side is what's happening to the year-over-year price gap on detached houses. The benchmark came in at $3,011,300, down 1.0% from June but now only 7.5% below July 2025. In January that gap sat at negative 12.2%. In May it was negative 9.7%. In June it was negative 9.2%. The gap is closing, month by month, without any dramatic price recovery, just a steady narrowing of the annual discount. That is what a price floor in formation looks like before it becomes anything else.
West Side house sales totalled 67 transactions, up 8.1% year-over-year, marking four consecutive months of positive annual comparisons in this segment. Townhouses also held up, with 38 sales representing an 18.8% gain over July 2025. Apartments were the weak spot: West Side condo sales of 245 came in 16.1% below July 2025, and the condo benchmark of $768,700 was down 1.3% from June.
Detached Benchmark: $3,011,300 (↓ 1.0% MoM | ↓ 7.5% YoY)
Townhouse Benchmark: $1,321,100 (↓ 2.3% MoM | ↓ 6.5% YoY)
Condo Benchmark: $768,700 (↓ 1.3% MoM | ↓ 6.4% YoY)
Vancouver East: Holding Its Ground
The East Side came in at 244 total sales in July, down 15.3% from June but essentially flat year-over-year (+0.4%). That flat annual comparison is worth noting: the East Side was running at positive 9.8% year-over-year in May and positive 7.5% in June, so the seasonal pullback was sharper here than on the West Side. Months of supply sits at 6.9, up from 6.4in June, and the East Side remains the tightest sub-market in the city.
East Side house sales reached 66 transactions, up 3.1% year-over-year. The house benchmark sits at $1,642,100, down 1.0% from June and 8.7% below a year ago. East Side townhouses were the standout: 35 sales, up 25% year-over-year, with months of supply in that segment extremely tight. East Side condo sales of 97 came in 16.4% below July 2025, and the apartment benchmark of $628,600 is down 7.5% annually.
Detached Benchmark: $1,642,100 (↓ 1.0% MoM | ↓ 8.7% YoY)
Townhouse Benchmark: $1,009,100 (↓ 4.3% MoM | ↓ 8.7% YoY)
Condo Benchmark: $628,600 (↓ 1.4% MoM | ↓ 7.5% YoY)
The Broader Benchmark: The Annual Gap Keeps Narrowing
Combined Detached Benchmark: $2,326,700 (↓ 1.0% MoM | ↓ 7.9% YoY)
Combined Townhouse Benchmark: $1,165,100 (↓ 3.2% MoM | ↓ 7.4% YoY)
Combined Apartment Benchmark: $698,650 (↓ 1.4% MoM | ↓ 6.9% YoY)
The combined detached house benchmark has now narrowed its year-over-year gap from negative 12.2% in January to negative 7.9% in July. Six months in a row. Prices are still below where they were a year ago, but the rate of decline is slowing in a consistent pattern rather than bouncing around. Across the city, detached sales of 133 came in 5.6% aboveJuly 2025, the fourth consecutive month of positive annual comparisons in that segment. Townhouse sales of 73 were up 21.7% year-over-year, the strongest segment reading in July by a meaningful margin. Apartment sales of 342 were down 16.2% from a year ago, and at $698,650, the condo benchmark is still off 6.9% annually. Months of supply for apartments sits at 6.6, which is not an illiquid market, but one where sellers are still generally not pricing where buyers are willing to land.
What This Means For You
July's numbers are best understood as a seasonal intermission rather than a change in direction. The trends that defined the spring are still largely intact: active inventory is running well below year-ago levels, detached house demand continues to outperform the broader market, and the annual price gap on houses is narrowing month by month. The dip in sales volume is normal. Every year this market goes quiet in July and picks back up as September approaches.
For buyers, the summer lull is often overlooked as an opportunity. Sellers who have been on market since spring and haven't yet transacted are typically more open to negotiation in July and August than they will be once the fall market brings in fresh inventory and renewed competition. Selection remains solid, and the pressure that will eventually return to this market has not fully arrived yet.
For sellers, the data keeps making the same argument it has since the beginning of the year: correctly priced properties are selling, and overpriced ones are not. The annual price gap on houses has been closing because buyers are returning to the market at current values, not at peak comparables. The listings driving those sales are the ones that were positioned for today's buyer from the start.
Reach out if you want to talk through what July's numbers mean for your home or your search.



 The data relating to real estate on this website comes in part from the MLS® Reciprocity program of either the Greater Vancouver REALTORS® (GVR), the Fraser Valley Real Estate Board (FVREB) or the Chilliwack and District Real Estate Board (CADREB). Real estate listings held by participating real estate firms are marked with the MLS® logo and detailed information about the listing includes the name of the listing agent. This representation is based in whole or part on data generated by either the GVR, the FVREB or the CADREB which assumes no responsibility for its accuracy. The materials contained on this page may not be reproduced without the express written consent of either the GVR, the FVREB or the CADREB.
Comments:
Post Your Comment: