As we move through the early months of 2026, the Vancouver real estate market continues to settle into what economists are calling the “new normal.” While we often expect a significant surge in activity as spring approaches, this year’s transition is proving to be more measured. The general observation of a "stabilizing" market is being tested by high inventory levels and a cautious buyer pool, yet there are some surprising shifts in the data, particularly when we look at the contrast between Vancouver’s East and West sides.
The Regional Picture: A Slow Slide Continues
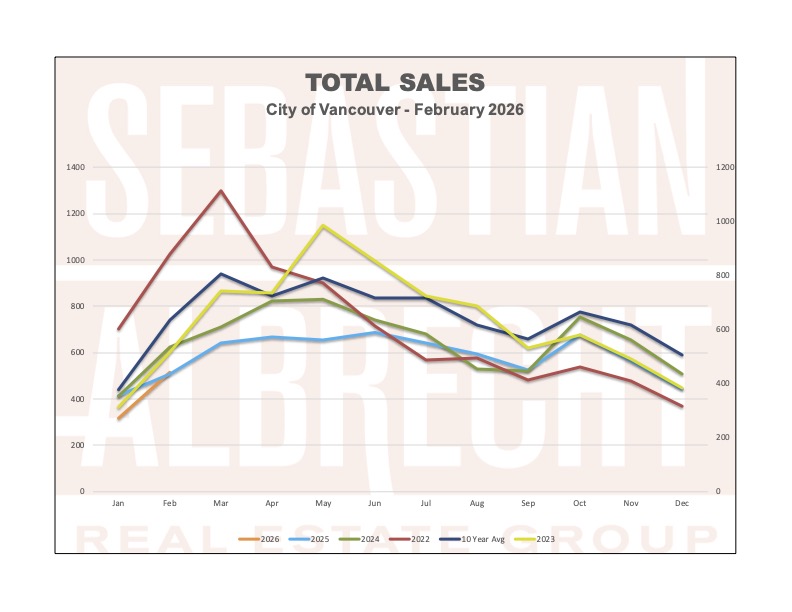
Across Metro Vancouver, sales remain nearly 29% below the 10-year seasonal average. Total residential sales for February came in at 1,648, which is a 9.8% decline from the same time last year. However, if we look at the short-term trend, we saw a modest 4.9% month-over-month increase in transactions compared to January. This suggests that while the market isn't "booming," it is slowly waking up from its winter slumber.
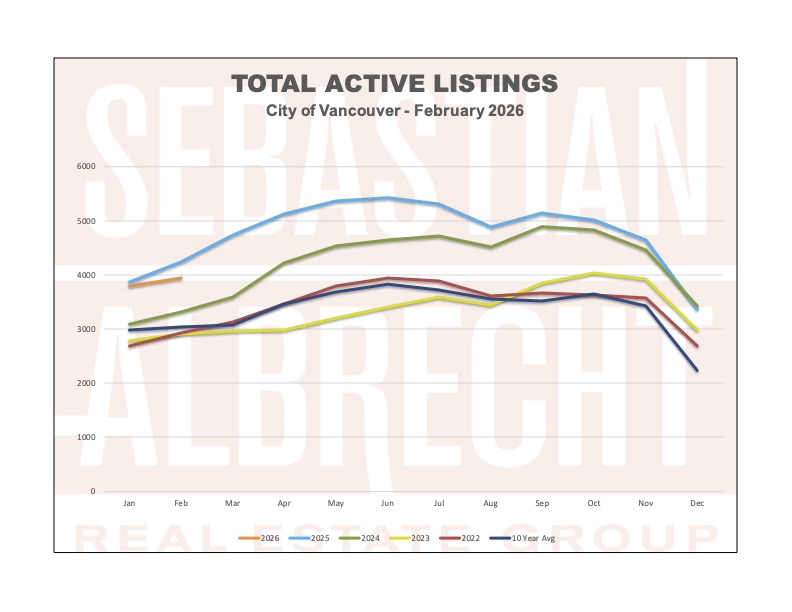
The most critical metric right now is inventory. Total active listings are sitting at 13,545, a significant 37% above the 10-year average. This provides buyers with a level of selection and negotiating leverage we haven't seen in years. Interestingly, the number of new listings entering the market dropped by 6.4% year-over-year, suggesting that some sellers are choosing to wait for more favorable conditions before planting their "For Sale" signs.
Vancouver West: The Luxury Recalibration
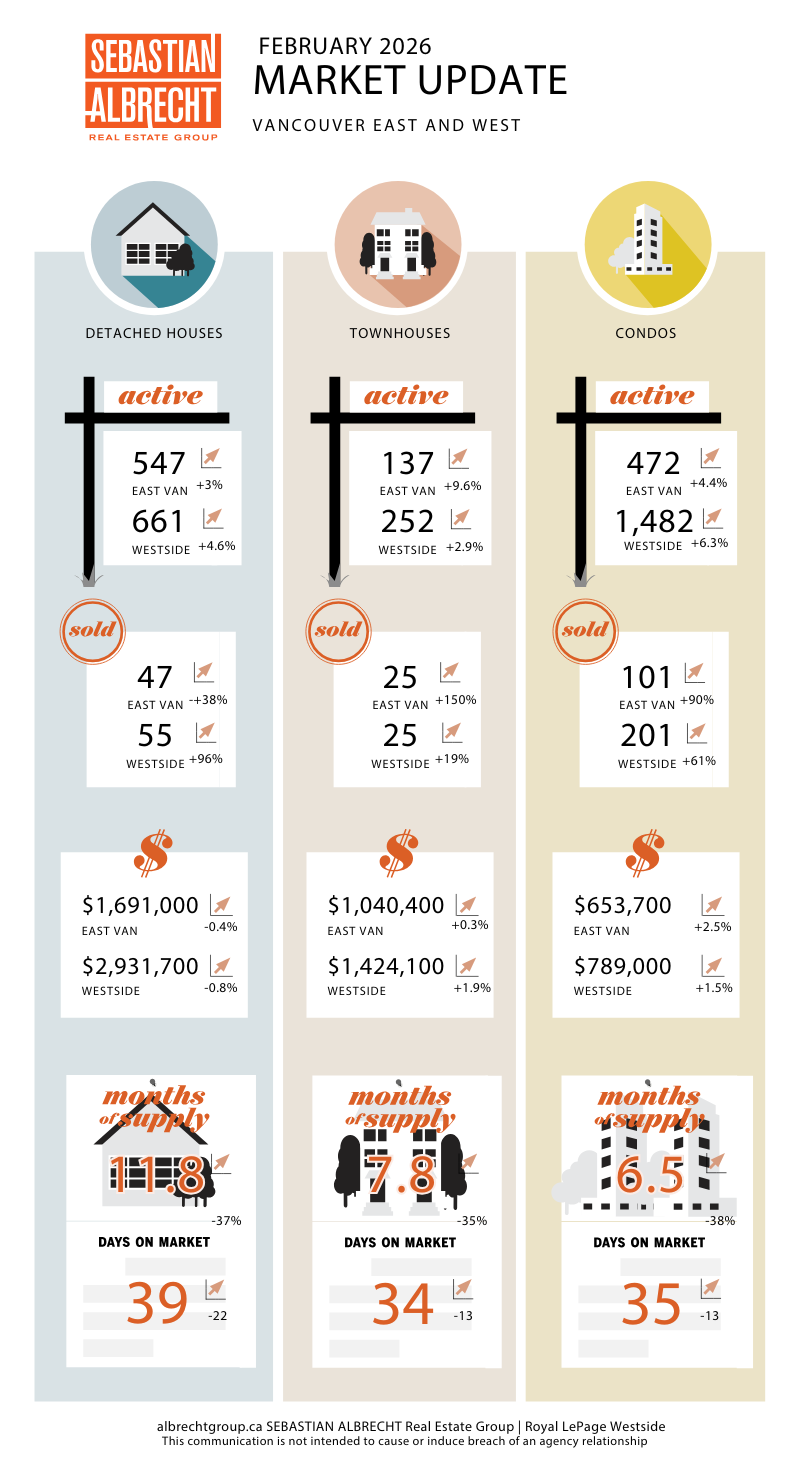
Vancouver West has seen the most dramatic price adjustments over the past twelve months. The benchmark price for a detached home on the West Side is now $2,931,700, representing a 13.7% decrease from February 2025. This is a substantial correction, essentially erasing over $400,000 in paper value for the typical detached home in just one year.
However, demand isn't dead. In a surprising turn, West Side detached sales jumped nearly 90% compared to January 2026. Buyers are clearly recognizing the value in these lower price points and are beginning to step back into the market.
Detached Benchmark: $2,931,700 (↓ 0.8% MoM | ↓ 13.7% YoY)
Townhouse Benchmark: $1,424,100 (↑ 1.9% MoM | ↓ 4.2% YoY)
Condo Benchmark: $789,000 (↑ 1.5% MoM | ↓ 6.1% YoY)
Vancouver East: Resilience and Relative Affordability
Vancouver East continues to show more resilience than its western neighbor. While detached prices are down 9.4% year-over-year, the monthly decline was a marginal 0.4%, indicating a much flatter trajectory.
The "star" of the East Side this month was the condo segment. Apartment prices actually ticked up 2.3% from January, the strongest monthly gain of any segment in the city. With a benchmark of $653,700, East Side condos are becoming one of the few "attainable" entry points for local owner-occupiers.
Detached Benchmark: $1,691,000 (↓ 0.4% MoM | ↓ 9.4% YoY)
Townhouse Benchmark: $1,040,400 (↑ 0.3% MoM | ↓ 9.3% YoY)
Condo Benchmark: $653,700 (↑ 2.3% MoM | ↓ 5.5% YoY)
What This Means For You
The current market is offering remarkable opportunities for buyers who have been sitting on the sidelines. With a sales-to-active ratio of 12.6%, we are on the edge of a "Buyer's Market." The greatest advantage today is time, the ability to conduct thorough due diligence and find the right property without the frantic pressure of multiple-offer scenarios.
For sellers, the "new normal" means strategy is everything. This is not a market where you can simply "test" a price; you need to be motivated and your pricing must align with today’s realities to stand out against the high volume of competing inventory.
If you are curious about how these numbers affect the value of your specific home, please reach out. I would be happy to help you navigate these shifting trends.


Comments:
Post Your Comment: