The split market we have been tracking through the early months of 2026 became impossible to ignore in April. Greater Vancouver’s headline numbers softened only modestly year‑over‑year, but underneath the average the picture is anything but uniform. Detached homes are quietly finding a floor, apartments are still doing most of the heavy lifting on the way down, and Vancouver’s East Side is now meaningfully outperforming the West.
The Regional Picture: A Quiet Pivot
Residential sales across Metro Vancouver totalled 2,110 in April, a 2.5% decline from the same time last year and roughly 23% below the 10‑year seasonal average. That is still a soft print, but it is the busiest month of 2026 so far. Total active listings sit at 16,236, virtually unchanged from a year ago and 37.9% above the 10‑year norm. The MLS® Home Price Index composite benchmark for Metro Vancouver dipped to $1,098,000, down 6.9% year‑over‑year and 0.6% from March.
The sales‑to‑active ratio came in at 13.5% region‑wide, which technically lifts us out of strict “Buyer’s Market” territory, but only just. The composition matters: detached sales were up 14% year‑over‑year, while apartment sales were down almost 11%. The detached market is quietly finding buyers; the apartment market is not.
Vancouver West: A Floor on Detached
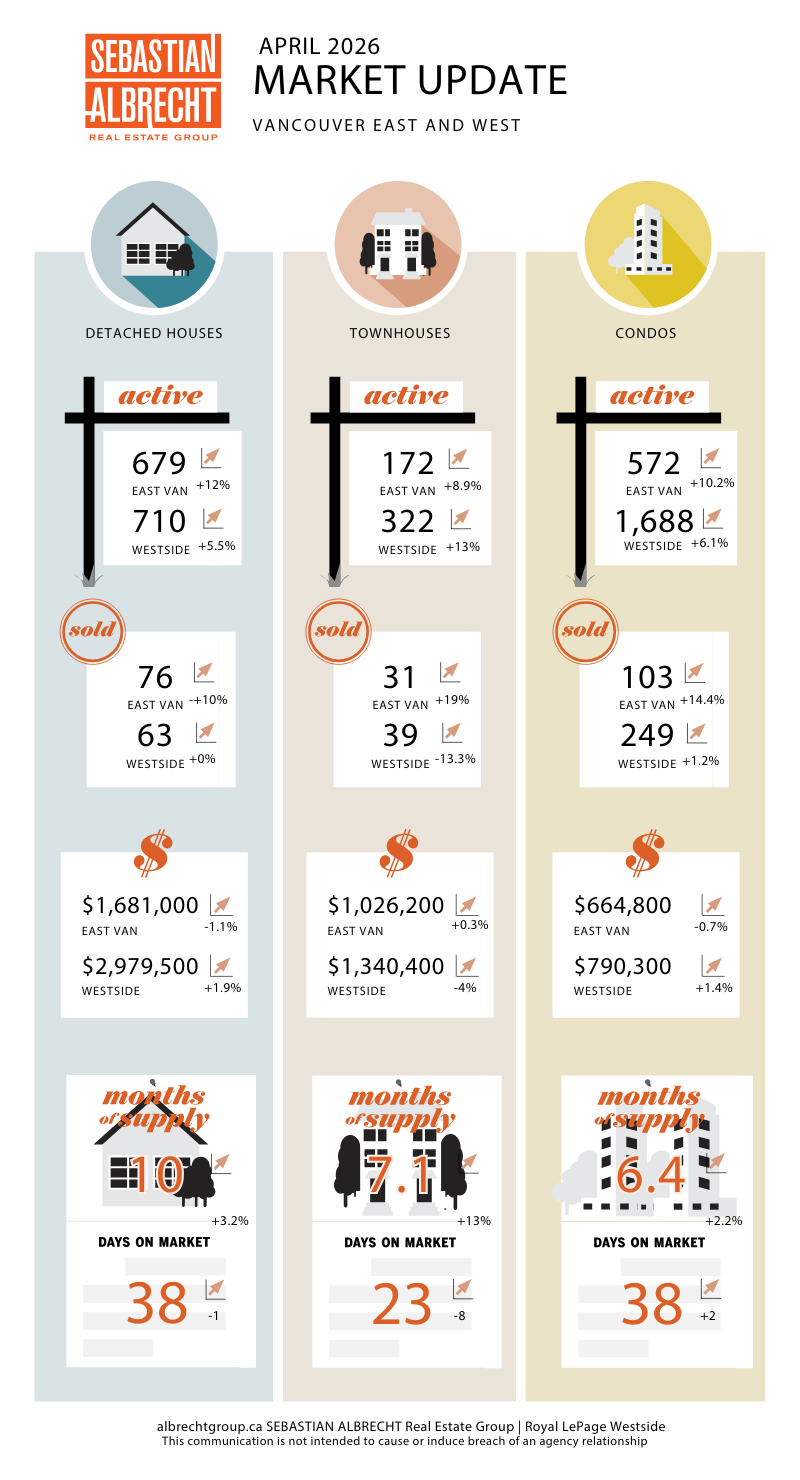
After roughly a year of uninterrupted monthly declines, the West Side detached benchmark turned higher in April, posting its first positive monthly print since early 2025. Year‑over‑year the number is still painful, down 11.6%, or roughly $390,000 in paper value off the typical West Side detached home, but the bleeding has clearly slowed. Detached sales of 63 were up 21.2% from April 2025, lifting the segment’s sales‑to‑active ratio to 8.9%. That is still in Buyer’s‑Market range, but it is the strongest reading we have seen here in over a year.
· Detached Benchmark: $2,979,500 (↑ 1.9% MoM | ↓ 11.6% YoY)
· Townhouse Benchmark: $1,340,400 (↓ 4.0% MoM | ↓ 5.4% YoY)
· Condo Benchmark: $790,300 (↑ 1.4% MoM | ↓ 6.8% YoY)
Vancouver East: Quietly the Strongest Market in the City
If the West Side is stabilizing, the East Side is genuinely accelerating. April sales of 257 were up 12.2% from March and 7.1% year‑over‑year, making it the only major sub‑market in the city to post a positive year‑over‑year sales number.
The standout story is in townhouses and condos. East Side townhouse sales jumped 40.9% year‑over‑year, pushing the segment’s sales‑to‑active ratio to 18.0%, and the apartment ratio matched at exactly 18.0%. Both are at the edge of Seller’s‑Market conditions, while benchmarks are still down 8.0% and 5.6% from a year ago. That makes the East Side one of the most interesting hunting grounds in the city right now.
· Detached Benchmark: $1,681,000 (↓ 1.1% MoM | ↓ 9.5% YoY)
· Townhouse Benchmark: $1,026,200 (↓ 1.7% MoM | ↓ 8.0% YoY)
· Condo Benchmark: $664,800 (↓ 0.7% MoM | ↓ 5.6% YoY)
What This Means For You
For buyers, the broad “Buyer’s Market” label that has worked across the region for nearly a year is no longer accurate everywhere. East Side townhouses and condos are genuinely competitive again, and the West Side detached floor appears to have been put in. There is still real selection and leverage on conditions, but the days of being the only offer on a well‑priced East Side condo are clearly behind us.
For sellers, the message is the same as it has been but more urgent: pricing accuracy is everything. The market is rewarding realism and punishing aspiration, even in segments where the headline numbers still look soft.
If you are curious about how these numbers affect the value of your specific home, please reach out. I would be happy to help you navigate these shifting trends.





 The data relating to real estate on this website comes in part from the MLS® Reciprocity program of either the Greater Vancouver REALTORS® (GVR), the Fraser Valley Real Estate Board (FVREB) or the Chilliwack and District Real Estate Board (CADREB). Real estate listings held by participating real estate firms are marked with the MLS® logo and detailed information about the listing includes the name of the listing agent. This representation is based in whole or part on data generated by either the GVR, the FVREB or the CADREB which assumes no responsibility for its accuracy. The materials contained on this page may not be reproduced without the express written consent of either the GVR, the FVREB or the CADREB.
Comments:
Post Your Comment: